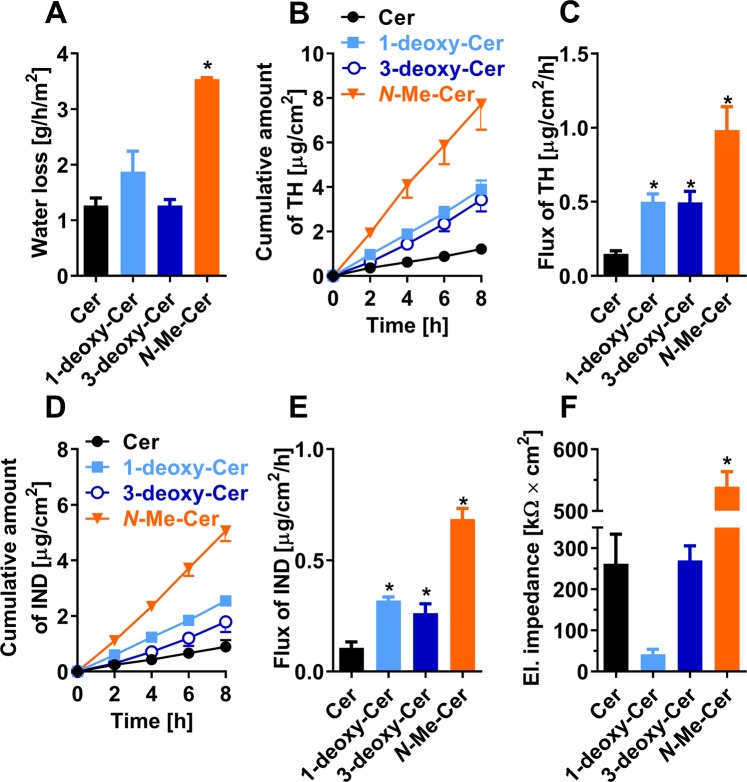
Figure 6.
The permeabilities of the studied SC lipid models composed either of Cer (black), or 1-deoxy-Cer (blue), or 3-deoxy-Cer (dark blue), or N-Me-Cer (orange), along with LIG, Chol, and CholS. (A) Water loss; (B) permeation profile for TH; (C) the flux of TH; (D) permeation profile for IND; (E) the flux of IND; (F) electrical impedance. Data are presented as the means ± standard error of the mean (SEM), n = 5–16. The asterisks show statistically significant differences against the Cer-containing sample (p <0.05).

