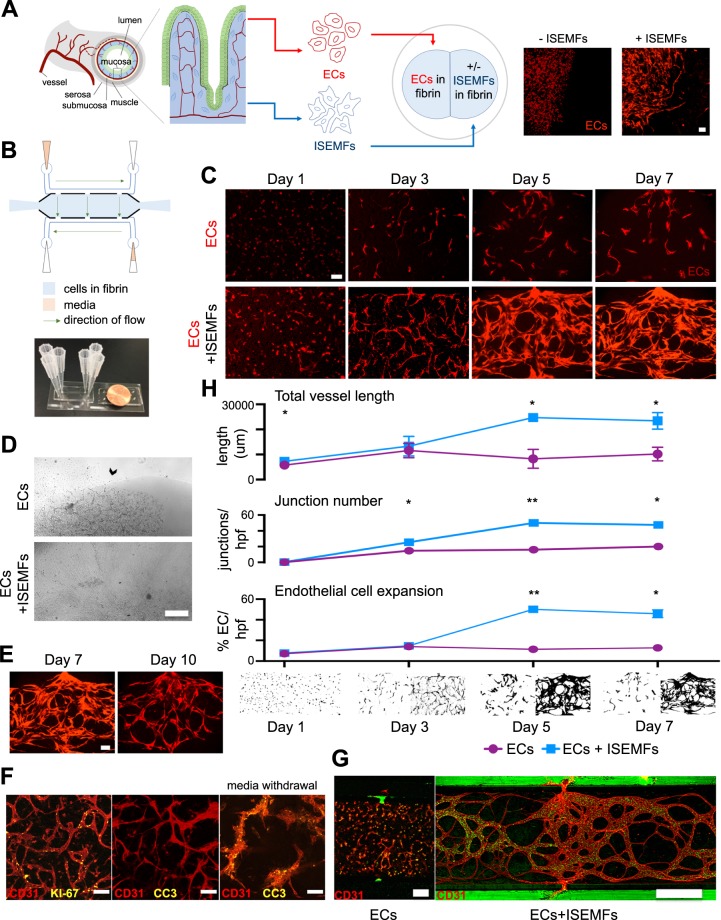
Figure 1.
Co-culture of patient-derived ISEMFs and ECs in microfluidic devices to generate perfused vasculature. (A) Schematic representation of SI mucosa, showing its capillary network, to be modeled ex vivo using ECs and ISEMFs. Representative images of fluorescent ECs cultured in the presence (right) or absence (left) of ISEMFs after 24 h are shown. Magnification: 10×, scale bar: 100 μm. (B) Schematic representation of microfluidic device, with actual device beside a penny for size comparison. The central culture chamber abuts media lines, synapsing with them via pores, resulting in a net flow of media and interstitial pressure across the chamber. (C) Effect of EC monoculture (above) vs. co-culture with ISEMFs (below) on vessel development over 7 days (n = 2 per condition). Magnification: 10×, scale bar: 100 μm. (D) Images of standard well-plate culture (as in 1A) of ECs cultured beside fibrin (above), vs ECs cultured beside fibrin-suspended ISEMFs (below), after 7 days in culture. Arrow highlights stability of adjacent fibrin in the absence of ISEMFs vs digestion and collapse of the culture system in the presence of ISEMFs. Magnification 4×, scale bar: 500 μm. This is compared to microfluidic culture (E), where vessel involution in not seen until day 10. Magnification 10×, scale bar: 100 μm. (F) Immunofluorescence co-localization of EC marker CD31 with proliferation marker KI-67 (left), and cell death marker CC3 (middle/right), on day 3 of culture. CC3 expression was only appreciable after media withdrawal (right). Magnification: 10×, scale bar: 100 μm. (G) Microfluidic culture of ECs alone (left, magnification 10×, scale bar: 100 μm), as compared to ECs + ISEMFs (right, magnification 4×, scale bar: 500 μm). 10 μm fluorescent beads (green) flowed through capillaries, which synapsed with microfluidic lines at the pores, in the EC + ISEMF condition only. (H) Quantification of angiogenesis in the presence (blue) or absence (purple) of ISEMFs, as in 1C. Measurements (from top to bottom) included total vessel length, junction number per hpf, and EC expansion (percent fluorescent ECs per hpf, on binary image analysis). Representative binary images are shown below graphs, with ECs (left) and ECs+ ISEMFs (right) at each time point. Graphs are mean +/− SD. *P < 0.05, **P < 0.01.

