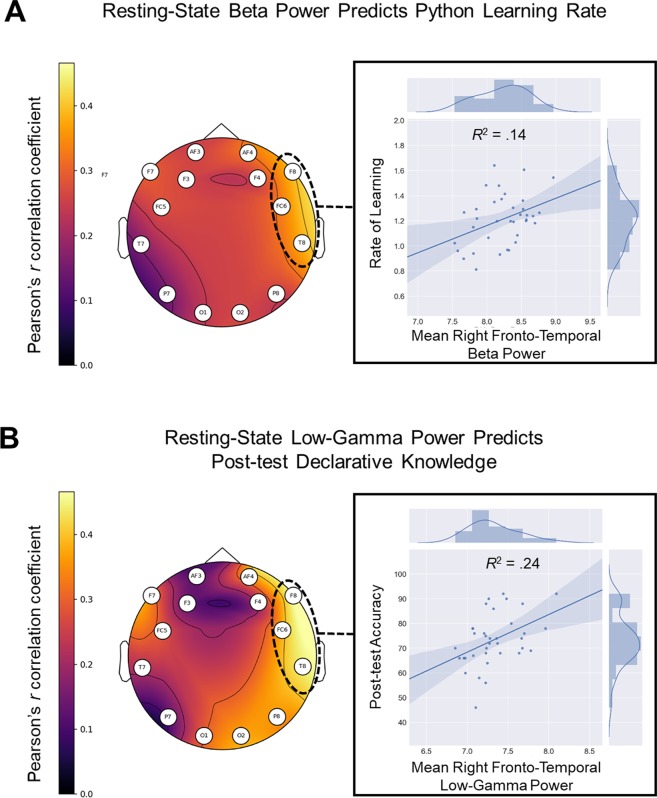
Figure 2.
Topomaps displaying the correlations between resting-state EEG power and Python learning outcomes across electrode locations and scatterplots showing data concatenated across right fronto-temporal networks (F8, FC6, T8). (A) Correlations between mean beta power (13–29.5 Hz) and Python learning rate across channels, with the relation between mean fronto-temporal beta power and learning rate depicted in scatter plot. (B) Correlations between mean low-gamma power (30–40 Hz) and post-test declarative knowledge across channels, with the relation between mean fronto-temporal low-gamma power and declarative knowledge depicted in scatter plot.

