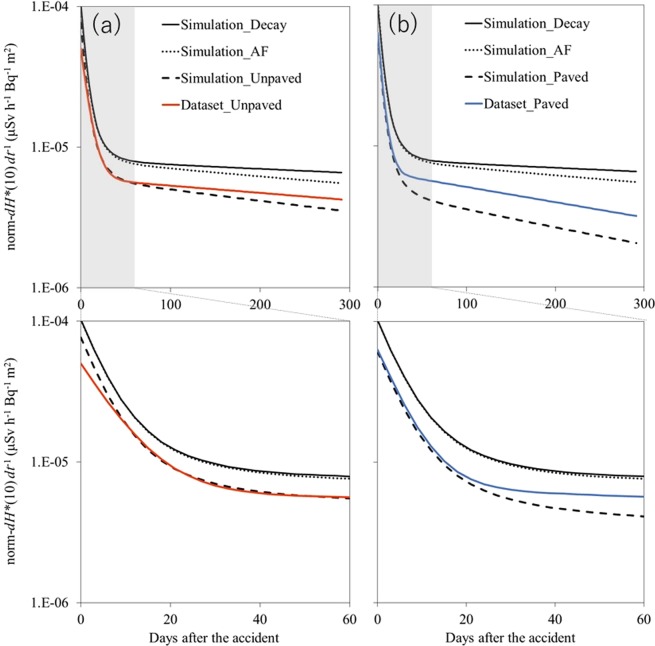
Figure 4.
Temporal decrease in the norm-dH*(10) dt−1 simulated according to UNSCEAR1 using parameters obtained in Europe after the CNPP accident (black lines) and modeled in this study (colored lines). The gray area in the upper figure indicates the initial 60-day period. The simulation and model were applied to both the (a) unpaved- and (b) paved-dominant fields. This study simulated three cases of decrease in the norm-dH*(10) dt−1: Case 1: decrease due to decay only (Simulation_Decay (solid line)); Case 2: decrease due to decay and radionuclide penetration into the ground (i.e., AF) (Simulation_AF (dotted line)); and Case 3: decrease due to decay, AF, and radionuclide washout (i.e., LF) (Simulation_Unpaved and Simulation_Paved (dashed line)).

