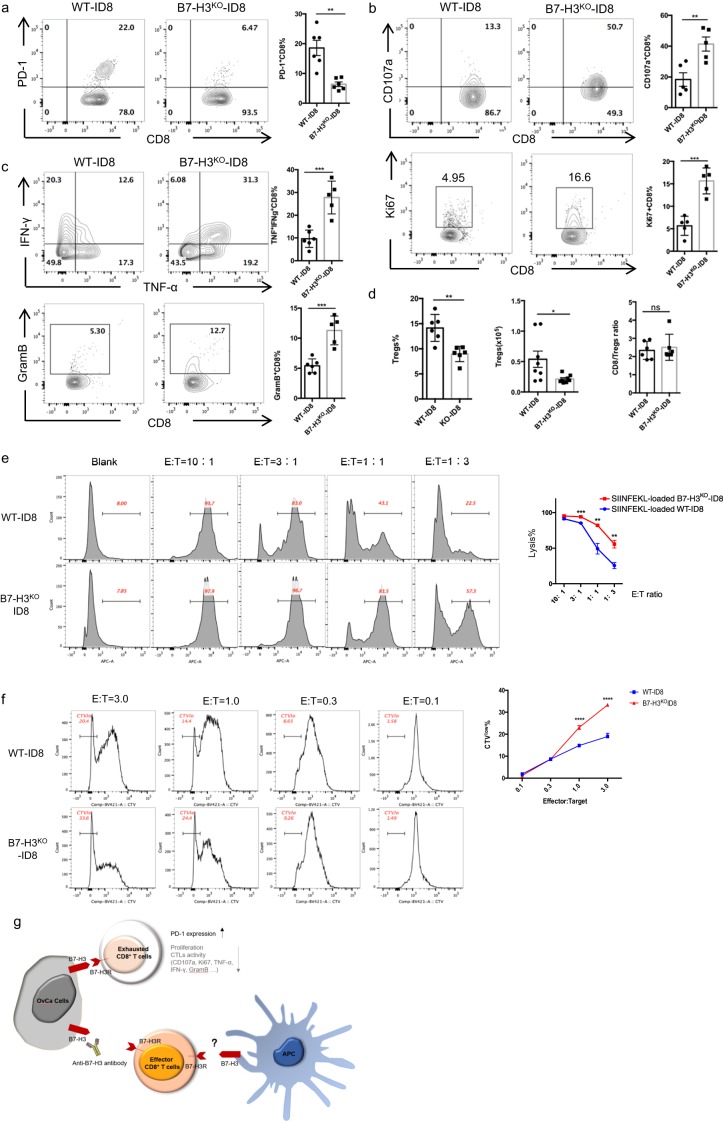
Fig. 4.
B7-H3 on ID8 cells induces dysfunction in CD8+ TILs. a Representative figures and summarized data showing PD-1 expression on CD8+ TILs. b Representative figures and summarized data showing the baseline expression of CD107a (upper panel) and Ki-67 (bottom panel) on CD8+ T cells in ascites or peritoneal lavage fluid from mice injected with 2 × 10⁶ WT or B7-H3KO-ID8 cells. c Representative figures and summarized data showing the expression of granzyme B, TNF-α, and IFN-γ after PMA and ionomycin stimulation. d Percentages and absolute cell numbers of Tregs and the ratio of CD8+ T cells to Tregs. e Representative figures and summarized data showing cytolysis of WT or B7-H3KO-ID8 cells, effector cells, OT-1 T cells, target cells, WT, or B7-H3KO-ID8 cells. f Representative figures and summarized data showing the proliferation rate of OT-1 T cells after coculture with WT or B7-H3KO-ID8 cells. Schematic diagram of how B7-H3 regulates antitumor immunity in OvCa. These experiments were repeated three times with similar data. Mean ± SEM; unpaired t test; *P < 0.05, **P < 0.01, ***P < 0.0001, and ****P < 0.00001

