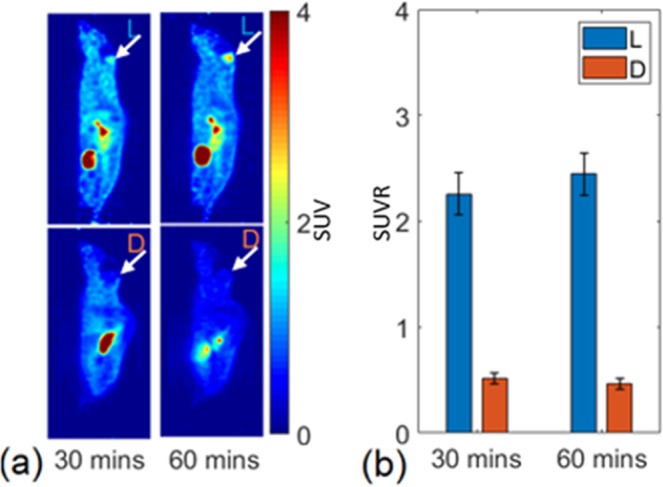
Figure 5.

Comparison of brain uptake of 1-L- and 1-D-[18F]FETrp uptake in medulloblastoma in the same mouse bearing a tumor. (a) Top panels show sagittal images following injection of the L-enantiomer, and bottom panels show sagittal images of the same mouse following injection of the D-form. Arrows denote position of the medulloblastoma. (b) Standardized uptake ratios (SUVR) for regions of interest over the medulloblastoma measured at 30 and 60 min post-injection.
