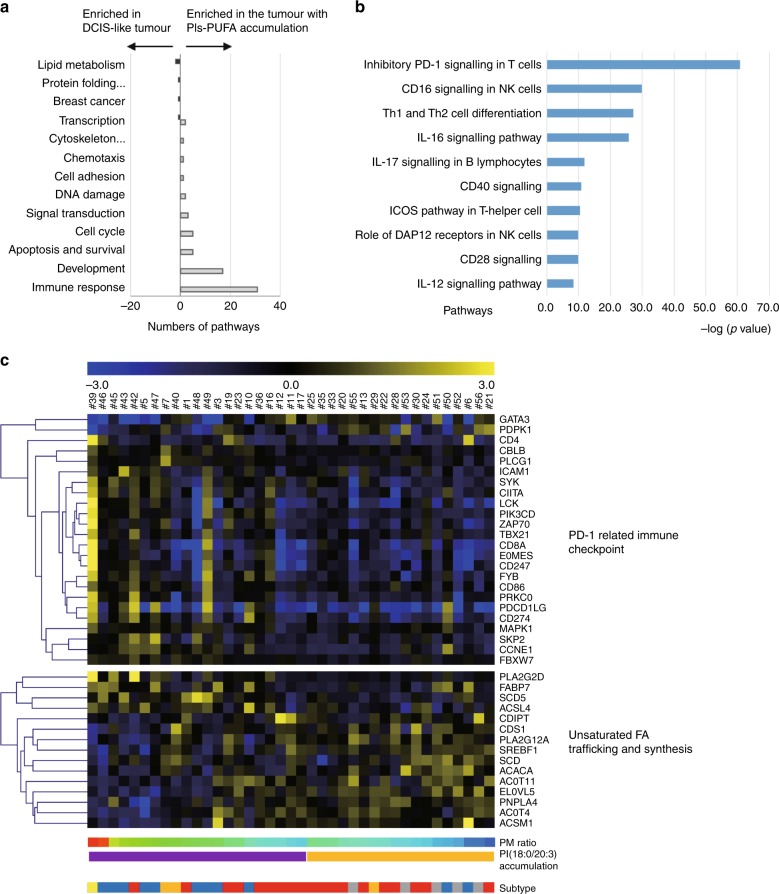
Fig. 4.
Molecular pathways associated with PI-PUFA accumulation in invasive cancers. a Gene ontology of the pathways differentially activated in the tumours with or without PI(18:0/20:3) accumulation. b The pathways related to the immune response that are differentially activated in invasive breast tumours with or without PI(18:0/20:3) accumulation. “–Log (p-value)” of each pathway is shown. c A heatmap illustrating the expression of individual genes related to “inhibitory PD-1 signalling in T cells” (upper) and “unsaturated fatty acid trafficking and synthesis” (lower). Gene expression values are indicated by a blue to yellow colour scale (top bar). The presence or absence of PI(18:0/20:3) accumulation in histological images is shown in purple and yellow, respectively. The values of the PM ratio are indicated by a rainbow colour scale (bottom bar). Tumour subtypes are shown in red (luminal), blue (triple negative), orange (luminal Her2), yellow (Her2) and grey (pure DCIS).

