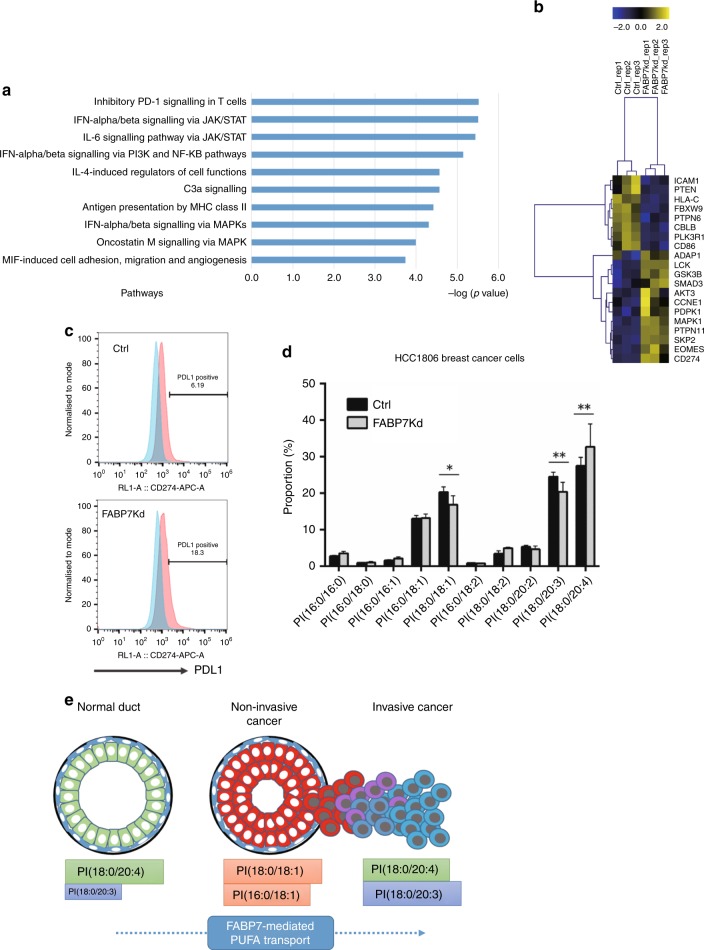
Fig. 5.
FABP7 knockdown induces the alteration of PD-1-related gene expression profile and PI composition in HCC1806 cells. a The pathways related to the immune response that are differentially activated in HCC1806 cells with or without FABP7 knockdown. The “–Log (p-value)” of each pathway is shown. b A heatmap illustrating the expression of individual genes related to “inhibitory PD-1 signalling in T cells”. Gene expression values are indicated by a blue to yellow colour scale (top bar). The analysis was performed in biological triplicate. c Flow cytometry analysis of PD-L1 expression. The x axis represents PD-L1 expression. The PD-L1-positive population was determined relative to the negative control peak (blue). d The difference of FA composition of PIs between HCC1806 cells with and without FABP7 knockdown. * indicates a statistically significant difference in the comparison two-way ANOVA with Sidak’s post hoc multiple comparisons test. **p < 0.01; ***p < 0.001; ****p < 0.0001. e The graphical abstract of this study.

