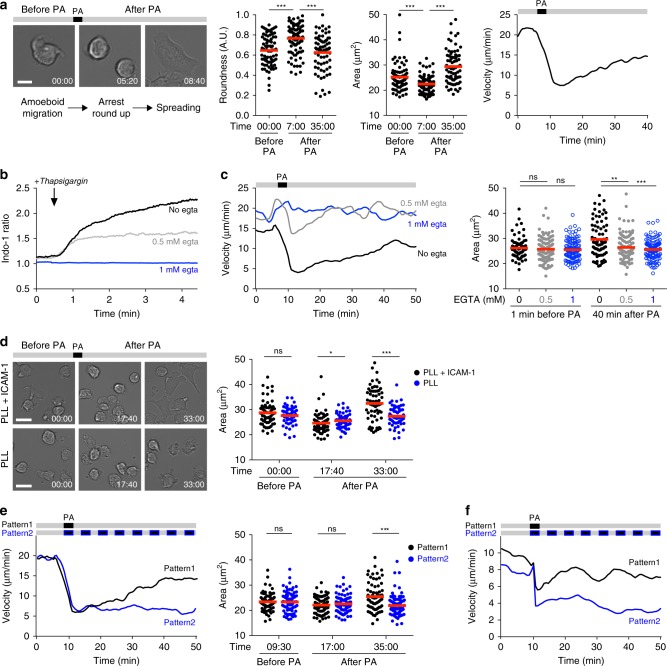
Fig. 2. Optogenetic manipulation of calcium signals in migrating T cells in vitro.
a eOS1-expressing B3Z T cell clones were deposited on Poly-L-Lysine (PLL) and ICAM-1-coated dishes and visualized by videomicroscopy and photoactivated with a 100 ms pulse of blue light. a Left, representative images showing the morphology of B3Z cells during ameboid migration (before PA), arrest and rounding up (after PA), and subsequent spreading and adhesion. Scale bar: 10 μm. Times are in min:sec. Middle, quantification of B3Z cells roundness and spreading (cell area) before and after PA. Each dot represents one cell. Bars represent mean values. Groups were compared using a two-tailed Mann–Whitney test (***p < 0.001). Representative of three independent experiments. Right, mean velocity of B3Z cells graphs as the function of time. Representative of six independent experiments. b, c Calcium influx is required for B3Z T cell arrest and adhesion. b B3Z cells were stained with Indo-1, resuspended in medium containing the indicated concentration of EGTA to totally (1 mM) or partially (0.5 mM) chelate extracellular Ca2+ and analyzed by flow cytometry. Thapsigargin was added at the indicated time point during the acquisition. Representative of two independent experiments. c Velocity and cell area of eOS1-expressing B3Z cells migrating on PLL + ICAM-1-coated surface and in the presence of the indicated concentration of EGTA are quantified before and after photoactivation. Representative of four independent experiments. Bars represent mean values. Groups were compared using a two-tailed Mann–Whitney test (**p < 0.01, ***p < 0.001). d eOS1-expressing B3Z cells were visualized migrating on PLL alone or PLL + ICAM-1-coated surfaces and subjected to photoactivation. Representative images (left) and cell area quantification (right) showing B3Z cell spreading after photoactivation occurs only in the presence of ICAM-1. Scale bar: 20 μm. Times are in min:sec. Representative of four independent experiments. Bars represent mean values. Groups were compared using a two-tailed Mann–Whitney test (ns p = 0.4715, *p = 0.01, ***p < 0.001). e Repeated photoactivations prolong B3Z T cell arrest (left) and limit cell spreading (right). B3Z cells were subjected to a single or multiple photoactivation (100 ms every 5 min). Representative of three independent experiments. Bars represent mean values. Groups were compared using a two-tailed Mann–Whitney test (ns p = 0.9257 and 0.4821, ***p < 0.001). f CD8+ T cells were activated and transduced to express eOS1, then deposited on PLL + ICAM-1-coated dishes before being subjected to a single or repeated (every 5 min) photoactivations. Representative of two independent experiments. Source data are provided as a Source Data File.

