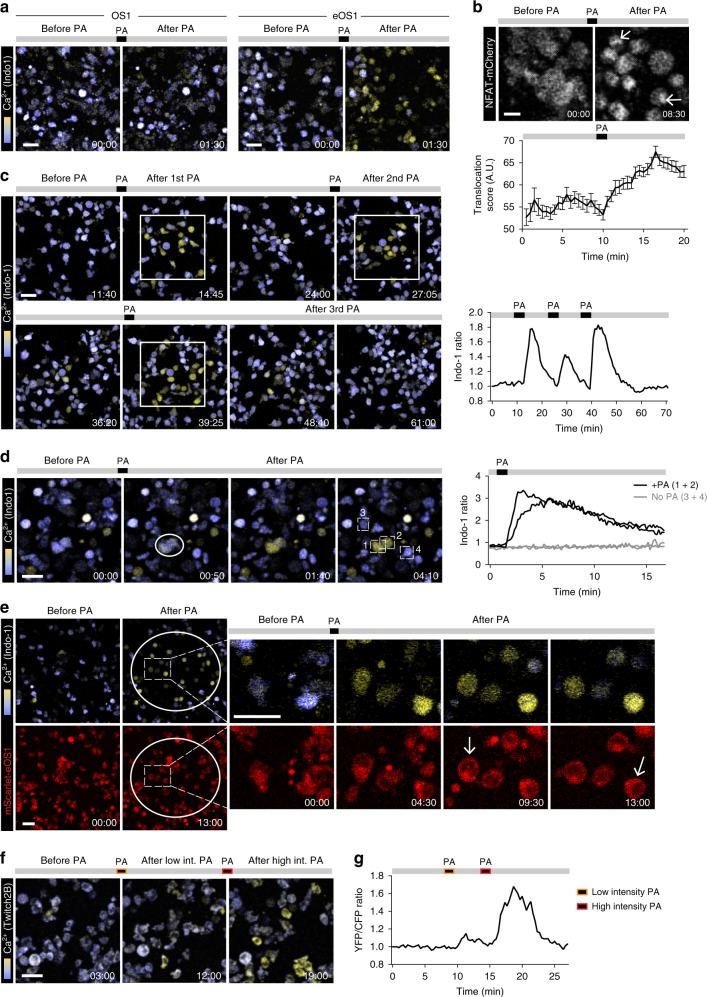
Fig. 4. Two-photon optogenetic manipulation of calcium signals using eOS1 actuator.
a B3Z T cell clones expressing either the OS1 or eOS1 calcium actuators were stained with Indo-1 and deposited on ICAM-1-coated surface. Cells were visualized using a two-photon laser tuned at 720 nm. PA: 940 nm; laser power 20%; galvano scanner at 10 µs/pixel. Scale bar: 30 μm. Representative of two independent experiments. b Nuclear translocation of NFAT following two-photon photoactivation of eOS1. A B3Z T cell clone expressing the eOS1 actuator and a NFAT-mCherry reporter was visualized using a two-photon laser tuned at 1040 nm. PA: 940 nm; laser power 20%; galvano scanner at 100 µs/pixel. Scale bar: 10 μm. Representative of two independent experiments. Quantification (bottom) of the translocation score, reflecting the increased intensity of mCherry fluorescence as NFAT accumulated in the nucleus. Results are shown as mean ±SEM (n = 78 cells). c, d Spatiotemporal patterning of photoactivation. An eOS1-expressing B3Z clone was stained with Indo-1 and deposited on ICAM-1-coated surface. c Images corresponding to three repeated photoactivations of a region of interest are shown (left) together with the calcium responses in the photoactivated area (right). PA: 940 nm; laser power 20%; galvano scanner at 10 µs/pixel. Scale bar: 30 μm. Representative of five movies in two independent experiments. d Left, photoactivation of two individual cells was performed at 940 nm with the laser power set at 10% and using the Tornado scanning mode (100 µs/pixel). Scale bar: 30μm. Right, quantification of calcium responses in photoactivated (#1 and #2) and non photoactivated cells (#3 and #4). Rare cells with high intracellular calcium before photoactivation corresponded to very transient events or to dead cells. e B3Z T cells expressing mScarlet-eOS1 were stained with Indo-1 and visualized using a two-photon laser tuned at 720 and 1040 nm (for Indo-1 and mScarlet imaging, respectively). PA: 940 nm; laser power 15%; galvano scanner at 20 µs/pixel. Note that mScarlet fluorescence redistributes close to the plasma membrane upon STIM-1 aggregation (arrow). Scale bar: 30 μm. Representative of two independent experiments. f, g B3Z T cells expressing the eOS1 actuator and the Twitch2B calcium indicator were visualized using a two-photon laser tuned at 830 nm. PA: 940 nm; laser power 15 or 20%; galvano scanner at 10 µs/pixel. Time-lapse images f and mean calcium signals g are shown before or after photoactivations. Scale bar: 30 μm. Representative of two independent experiments. Source data are provided as a Source Data File.

