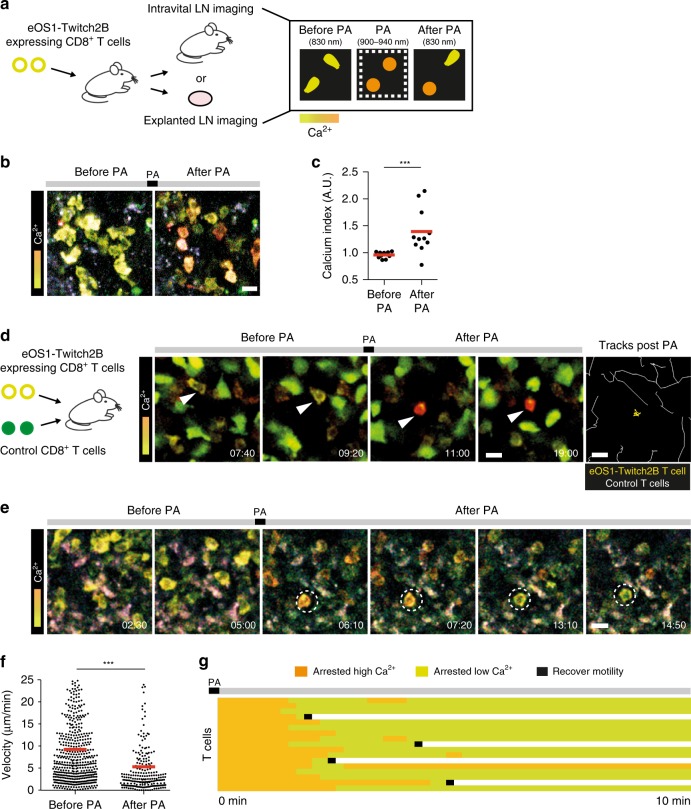
Fig. 5. Simultaneous imaging and manipulation of calcium signals in individual T cells in lymph nodes.
a Experimental setup for optogenetic manipulation of T cells in lymph nodes. b–g CD8+ T cells expressing the eOS1 actuator and the Twitch2B calcium indicator were adoptively transferred. After 1–5 days, intravital imaging of the popliteal lymph node or explanted lymph node imaging was performed using two-photon microscopy. b, c Time-lapse images b and quantification c showing calcium levels (Twitch2B signals, YFP:CFP ratio) in T cells before and after photoactivation during intravital imaging. Photoactivation was performed by tuning the laser at 900 nm with the laser power set at 25%, using the resonant scanner (0.067 µs/pixel). Scale bar: 10 µm. Each dot represents one cell. Bars represent mean values. Statistical significance was assessed using a two-tailed Mann–Whitney test (***p < 0.001). d eOS1-expressing T cells but not control T cells react to two-photon photoactivation. CD8+ T cells expressing the eOS1 actuator and the Twitch2B calcium indicator were adoptively transferred together with CFP-expressing control T cells. After photoactivation in explanted lymph nodes, eOS1-expressing T cells (yellow cells) arrested while control T cells (green cells) maintained their motile behavior. Photoactivation was performed at 900 nm with the laser power set at 30% using the resonant scanner (0.067 µs/pixel). Scale bar: 10 µm. Times are in min:sec. White arrows show an eOS1-expressing T cell. Representative of five independent experiments. e Calcium signals can promote prolonged arrest in T cells. Time-lapse images show that two-photon photoactivation elicits a transient calcium elevation and T cell arrest in explanted lymph nodes. Dotted circles highlight one T cell over time. Photoactivation was performed at 900 nm with the laser power set at 30% using the resonant scanner (0.067 µs/pixel). Scale bar: 10 µm. Times are in min:sec. Representative of five independent experiments. f Quantification of T cell velocities before or just after photoactivation. Each dot represents one cell. Bars represent mean values. Statistical significance was assessed using a two-tailed Mann–Whitney test (***p < 0.001). g Calcium signals can promote prolonged T cell arrest. The figure compiles the fate of individual T cells after photoactivation. Each line represents a cell. Note that after a few minutes, calcium levels return to baseline levels but many T cells remain arrested. Source data are provided as a Source Data File.

