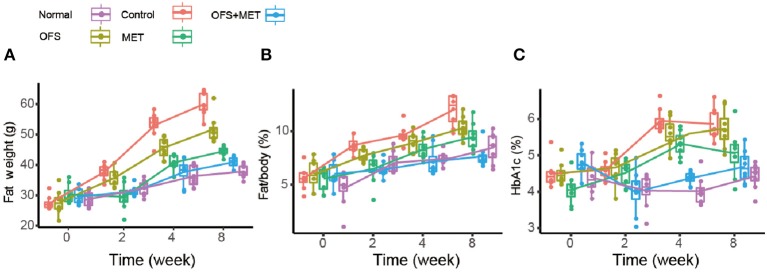
Figure 1.
Boxplots (with median) showing (A) fat weight, (B) %fat/body, and (C) %HbA1c before treatment (0 week) and after 2, 4, and 8 weeks in DIO rats randomized to control (C2, C4, and C8), OFS (O2, O4, and O8), MET (M2, M4, and M8; n = 8), and OFS+MET (OM2, OM4, and OM8). P < 0.05, 0.01, 0.001 using one-way ANOVA vs. saline-treated control (*, **, ***). All data are expressed as mean ± S.E.M. (n = 8).

