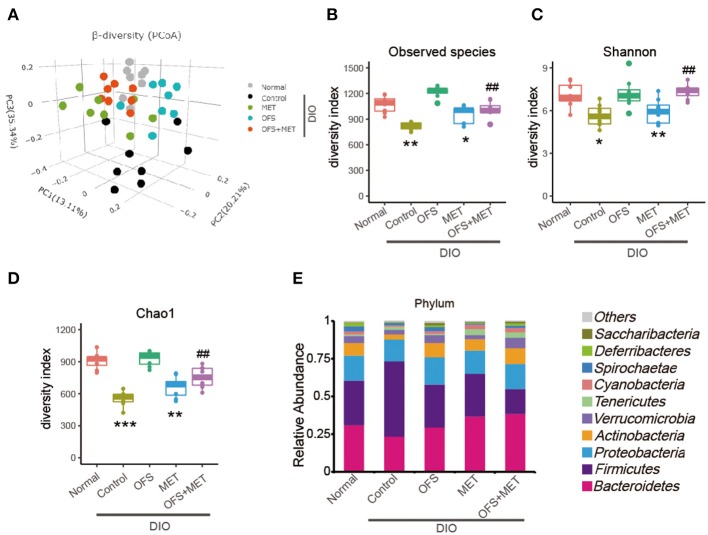
Figure 4.
Differential profiles of gut microbiota among Control, MET, OFS, and MET+OFS. (A) 3D plot of unweighted UniFrac PCoA of intestinal microbiota extracted from rat fecal samples. Compared with the gut microbial diversity including (B) Observed species index; (C) Shannon index; (D) Chao1 index; (E) Phylogenetic profiles of gut microbes among Control, MET, OFS, and MET+OFS at the phylum level. Data are shown as mean ± S.E.M. (n = 8) (*P < 0.05, **P < 0.01, #Tukey test).

