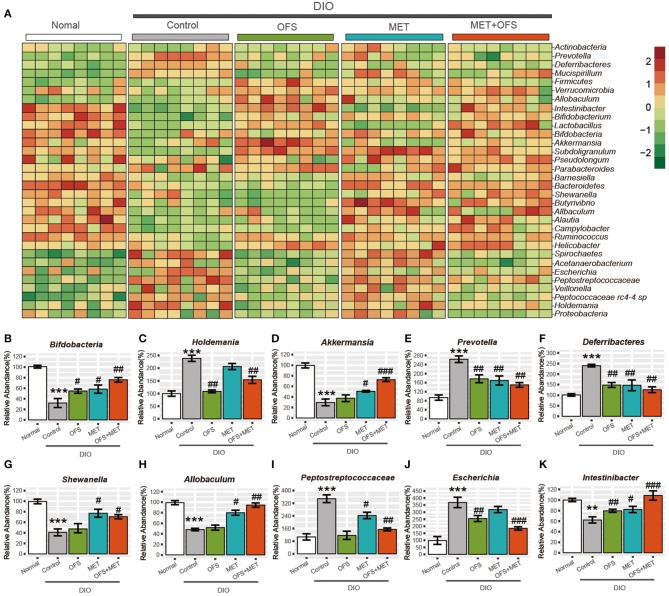
Figure 5.
Effects of oligofructose and metformin on levels of gut microbiota in DIO rats. (A) Heat map was constructed comparing significantly different abundance of species. (B–K) The top10 significantly different microbial community at the species level (mean ± SEM, Student t-test, FDR, n = 8; **P < 0.01, ***P < 0.001, vs. Normal group; #P < 0.05, ##P < 0.01, ###P < 0.001, vs. Control group).

