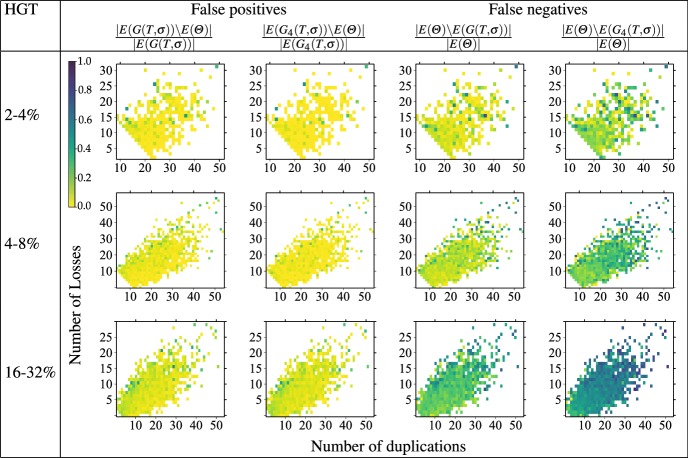
Fig. 13.
Dependence of the fraction of false positive and false negative orthology assignments in RBMGs in the presence of different levels of HGT, measured as percentage of HGT events among all events in the simulated true gene trees . As in Fig. 10, data are shown as functions of the number of duplication and loss events in the scenario. While the number of false positives seems to depend very little on even high levels of HGT, the fraction of false negatives is rapidly increasing. Since HGT introduces good quartets that comprise only true orthology edges, their removal further increases the false positive rate (last column) (color figure online)

