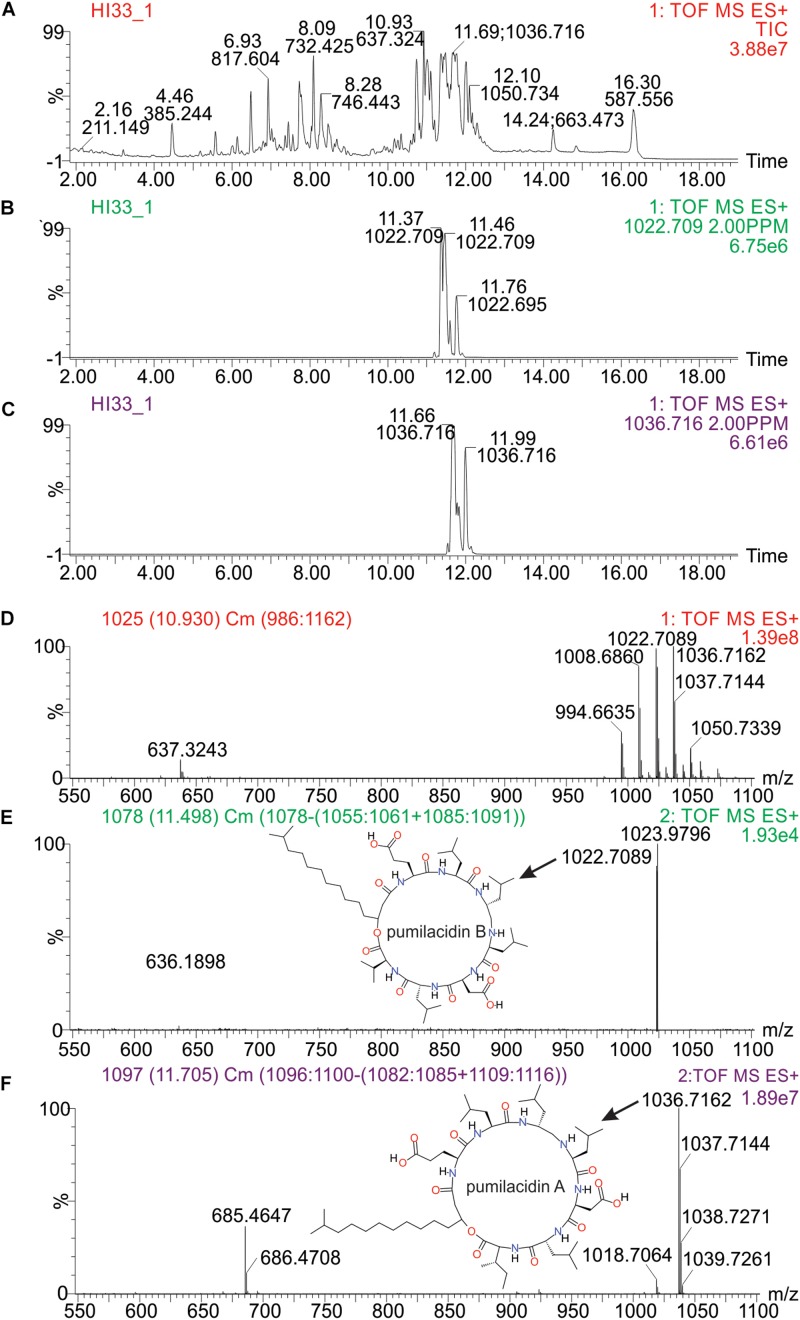
FIGURE 10.
Analysis of specific metabolites from strain HI33, including: (A) total ion chromatogram from ESI + full scan MS analysis of the ethyl acetate extract from liquid cultures of the strain grown for an extended period as described in section “Materials and Methods,” (B,C) selected ion chromatograms for compounds with m/z 1022.709 and m/z 1036.716, respectively, (D) combined full mass spectrum for the compounds eluting between 10.5 and 12.5 min in the UPLC-MS analysis, and (E,F) the MSE spectra for the peaks at 11.5 and 11.7 min in the UPLC-MS/MS analysis, respectively, including the structures of pumilacidin B and pumilacidin A (candidate compounds in this cluster, inset) collected from PubChem (Kim et al., 2016).

