FIGURE 6.
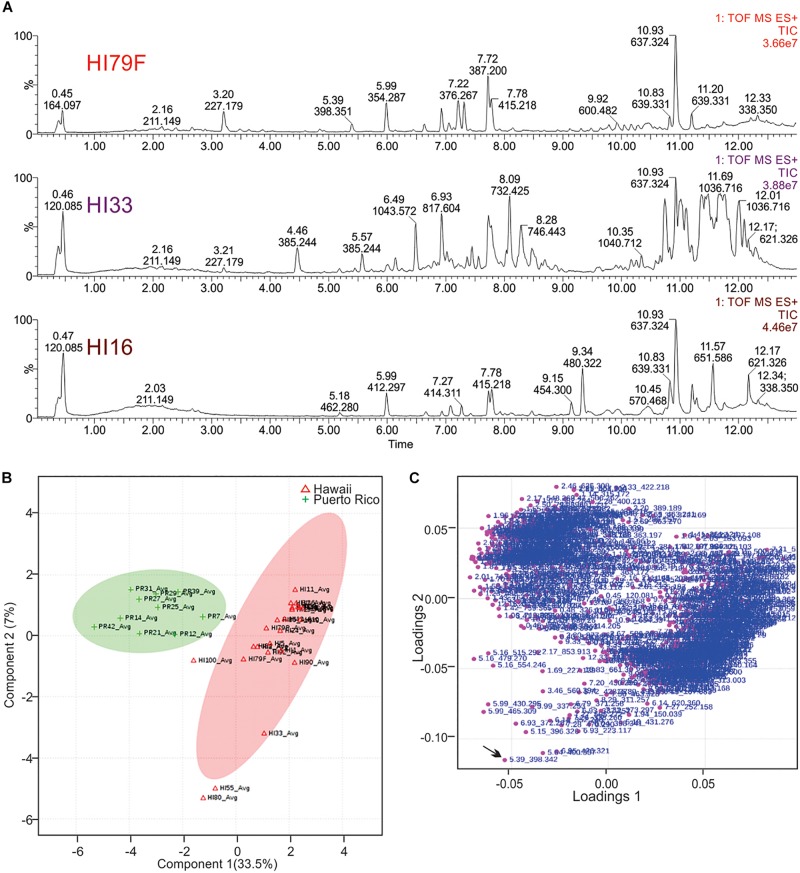
Principal Components Analysis of metabolites produced by strains from Hawai’i and Puerto Rico. (A) Total ion current (TIC) chromatograms from representative strains from Hawai’i. (B) PCA scores plot comparing strains from Puerto Rico and Hawai’i. The “Avg” suffix indicates that the “samples” displayed are the average values of all 5 replicates analyzed per strain. (C) Loadings plot from PCA analysis.

