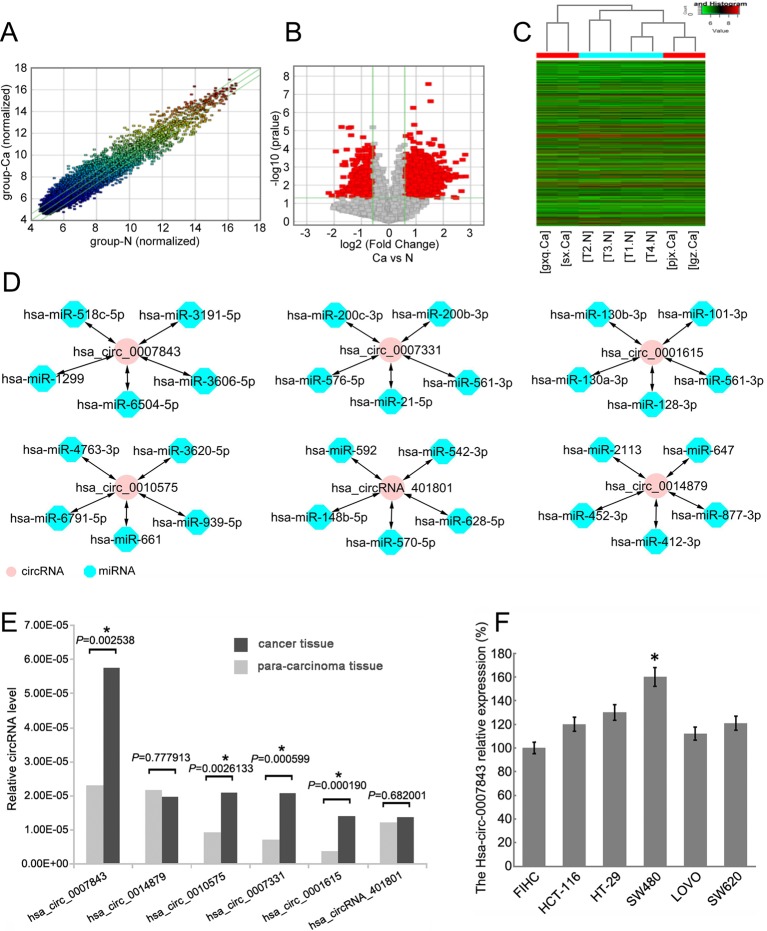
Figure 1.
Hsa_circ_0007843 expression is upregulated in colon cancer tissue and cell lines. (A) Scatter-plot showing circRNA expression variation between colon cancer tissue samples and paracancerous tissue samples. The values of the X and Y axes represent the normalized signal values. The circRNAs above the top green line and below the bottom green line indicates a greater than 2.0-fold change of the circRNAs between the two compared samples. (B) Volcano plots showing the differential expression of circRNAs. (C) Hierarchical clustering heat map showing the different circRNA expression profiles of the 8 samples. (D) miRNA targets of the 6 circRNAs predicted by bioinformatics software. (E) Relative expression of the 6 circRNAs in colon cancer and paracancerous tissues. * P < 0.05. (F) Relative expression of hsa_circ_0007843 in colon cancer cell lines by RT-PCR. Each bar represents the mean of 3 independent experiments. * P < 0.05.

