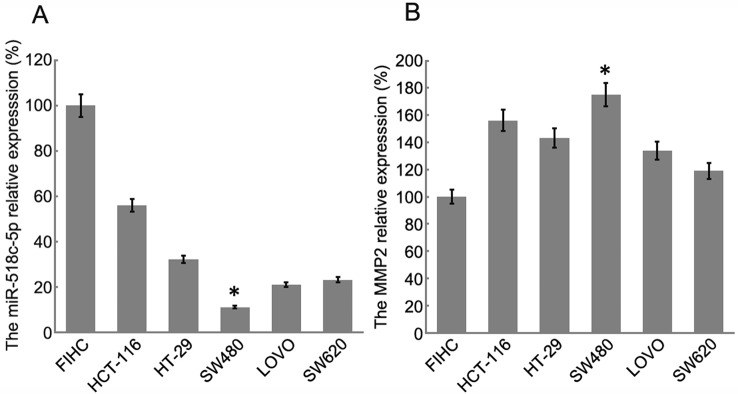
Figure 3.
Relative expression of miR-518c-5p and MMP2 in colon cancer cell lines by RT-PCR. (A) Relative expression of miR-518c-5p; each bar represents the mean of 3 independent experiments. * P < 0.05. (B) Relative expression of MMP2; each bar represents the mean of 3 independent experiments. * P < 0.01.

