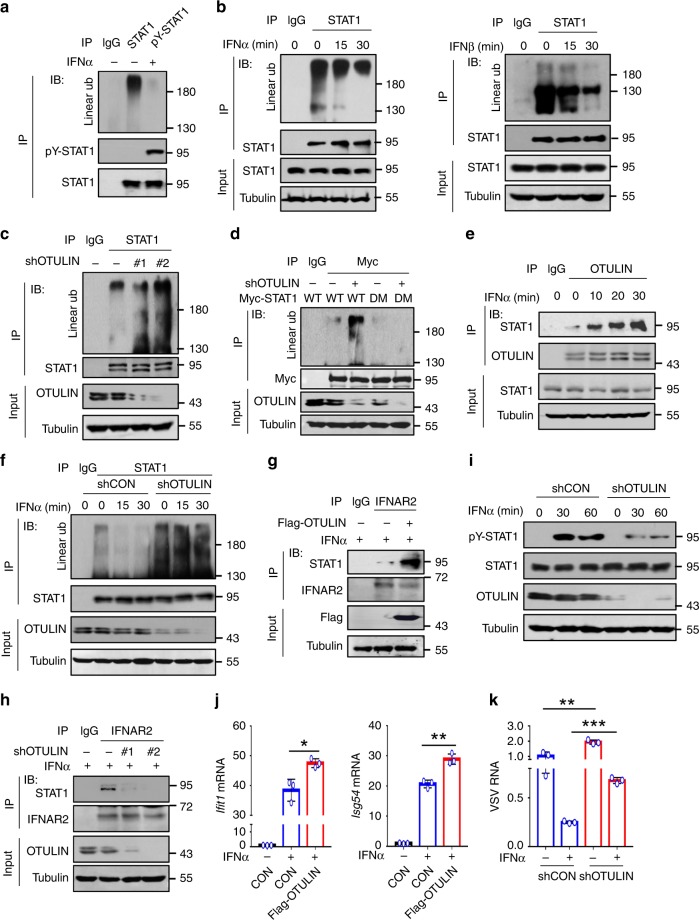
Fig. 5. IFN-I stimulation removes STAT1 linear ubiquitination.
a Immunoprecipitation analysis of linear ubiquitination of STAT1 and pY-STAT1 in HEK293T cells treated with IFNα (1000 IU/ml) for 30 min. b Immunoprecipitation analysis of linear ubiquitination of endogenous STAT1 in 2fTGH cells treated with IFNα or IFNβ (1000 IU/ml) as indicated. c Immunoprecipitation analysis of linear ubiquitination of STAT1 in HEK293T cells transfected with shRNAs against OTULIN (shOTULIN, #1 and #2). d Immunoprecipitation analysis of linear ubiquitination of STAT1 in HEK293T cells transfected with Myc-STAT1 (WT or DM) and shOTULIN. e Immunoprecipitation analysis of the interaction between OTULIN and STAT1 in 2fTGH cells treated with IFNα (1000 IU/ml) as indicated. f Immunoprecipitation analysis of linear ubiquitination of STAT1 in HEK293T cells transfected with shOTULIN and then treated with IFNα (1000 IU/ml) as indicated. g, h Immunoprecipitation analysis of the interaction between endogenous IFNAR2 and STAT1 in HEK293T cells transfected with either Flag-OTULIN (g) or shOTULIN (#1, #2) (h), and treated with IFNα (1000 IU/ml) for 15 min. i Western blot analysis of pY-STAT1 in HEK293T cells transfected with shOTULIN and then treated with IFNα (1000 IU/ml) as indicated. j RT-qPCR analysis of the representative ISGs (Ifit1 and Isg54) mRNA in HEK293T cells transfected with Flag-OTULIN and stimulated with IFNα (1000 IU/ml) for 4 h. k RT-qPCR analysis of VSV viral RNA in 2fTGH cells transfected with shOTULIN and then stimulated with IFNα (60 IU/ml) for 20 h, followed by infection with VSV (MOI = 0.1) for 24 h. *p < 0.05, **p < 0.01, and ***p < 0.001 (two-tailed unpaired Student’s t test). Data are shown as mean and s.d. of three biological replicates (j, k), or are representative of three independent experiments (a–i).

