Fig. 1.
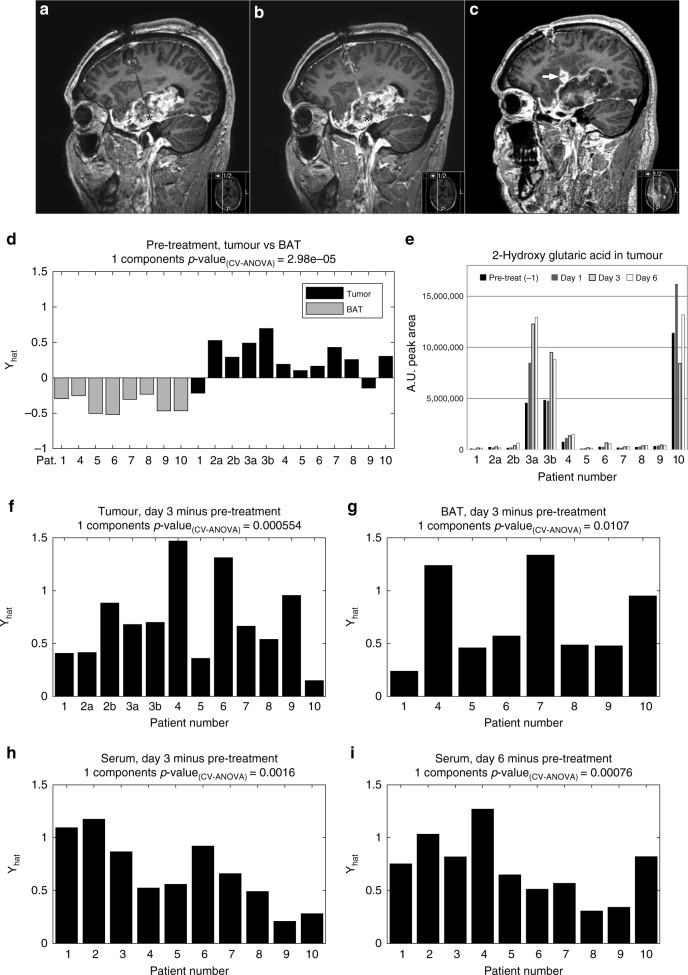
Contrast-enhanced MR-images of patient no. 5. a Before start of treatment. b After five days of cisplatin treatment. Black asterisk in A–B marks tip of microdialysis catheter. c One months after ten days of cisplatin treatment demonstrating widespread necrosis in the tumour area. White arrow in C marks inflammatory response at the catheter site. d Multivariate statistical OPLS-DA model comparing metabolite levels detected in microdialysis fluids from tumour and BAT. e Relative quantification of 2-hydroxy glutaric acid concentration in microdialysis fluids from the extracellular compartment of tumour tissue pre-treatment, and after one to 6 days of cisplatin treatment. For patient number 2 and 3, dialysate from two treatment catheters was available for analysis, denoted 2a, 2b, 3a and 3b. f, g Paired multivariate OPLS-EP models comparing metabolite levels detected in microdialysis fluids from tumour (f) and BAT (g) prior to treatment to levels after 3 days of cisplatin treatment. h, i Paired multivariate OPLS-EP models comparing metabolite levels detected in serum prior to treatment to levels after 3 days (h) or 6 days (i) of cisplatin treatment. Statistical significances for the cross-validated models are indicated by CV-ANOVA.

