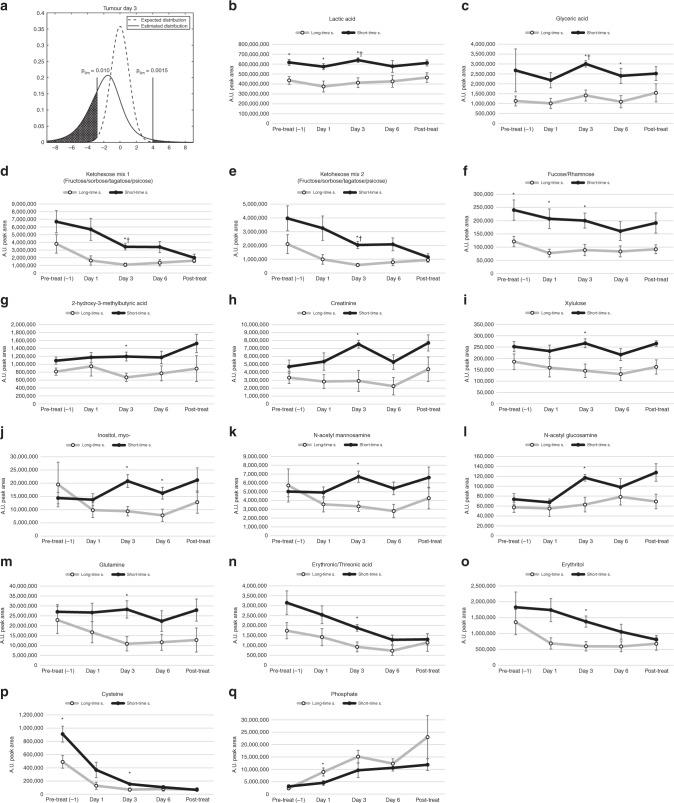
Fig. 4.
Treatment response patterns for selected metabolites in microdialysate from tumour of long-time and short-time survivors. a The dashed line indicates the expected t-value distribution if there were no significant differences. The solid line indicates estimated t-value distribution from comparisons of metabolite levels in short-time survivor vs. long-time survivor detected in microdialysis fluids from tumours after 3 days of treatment. The limits indicate regions where the probability is more than 10 time higher in the estimated distribution. b–q Metabolites detected in microdialysis fluids with suggestively different concentrations when comparing long-time survivors (○) to short-time survivors (●). Values on x-axes indicated sampling times; one day prior to treatment, after 1–6 days of treatment and after the treatment has ended. Values on y-axes show mean arbitrary units for quantified peak area ± SEM. *p < 0.05, †b–h FDR < 0.1.

