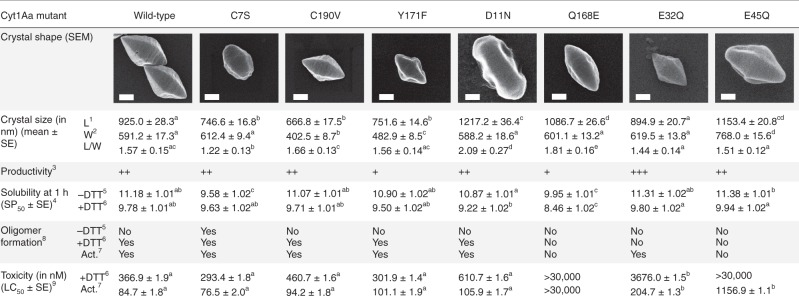
Fig. 3. Point mutations affect different steps along the Cyt1Aa bioactivation cascade.
For each row, different letters indicate significant differences between mutants. 1Length and 2width of crystals. 3Productivity was visually estimated based on the quantity and aspect of the crystal-spore suspension collected. 4SP50 corresponds to the concentration at which 50% of crystals solubilize after 1 h incubation at RT. See Supplementary Table 2 for corresponding statistics. 5Protoxin solubilized without DTT, releasing a disulfide-bridged dimer (except for C7S), and 6with DTT, releasing a protoxin monomer. 7Toxin monomer activated by proteinase K. 8Capacity of each toxin species to generate a ladder pattern characteristic of membrane-bound oligomers (MBO) on 6% SDS-PAGE. See corresponding gels in Supplementary Fig. 9. 9LC50 corresponds to the concentration lethal for 50% of cell population. See Supplementary Table 2 for corresponding statistics. Scale bar = 0.2 µm. Source data are provided as a Source Data file.

