Fig. 1.
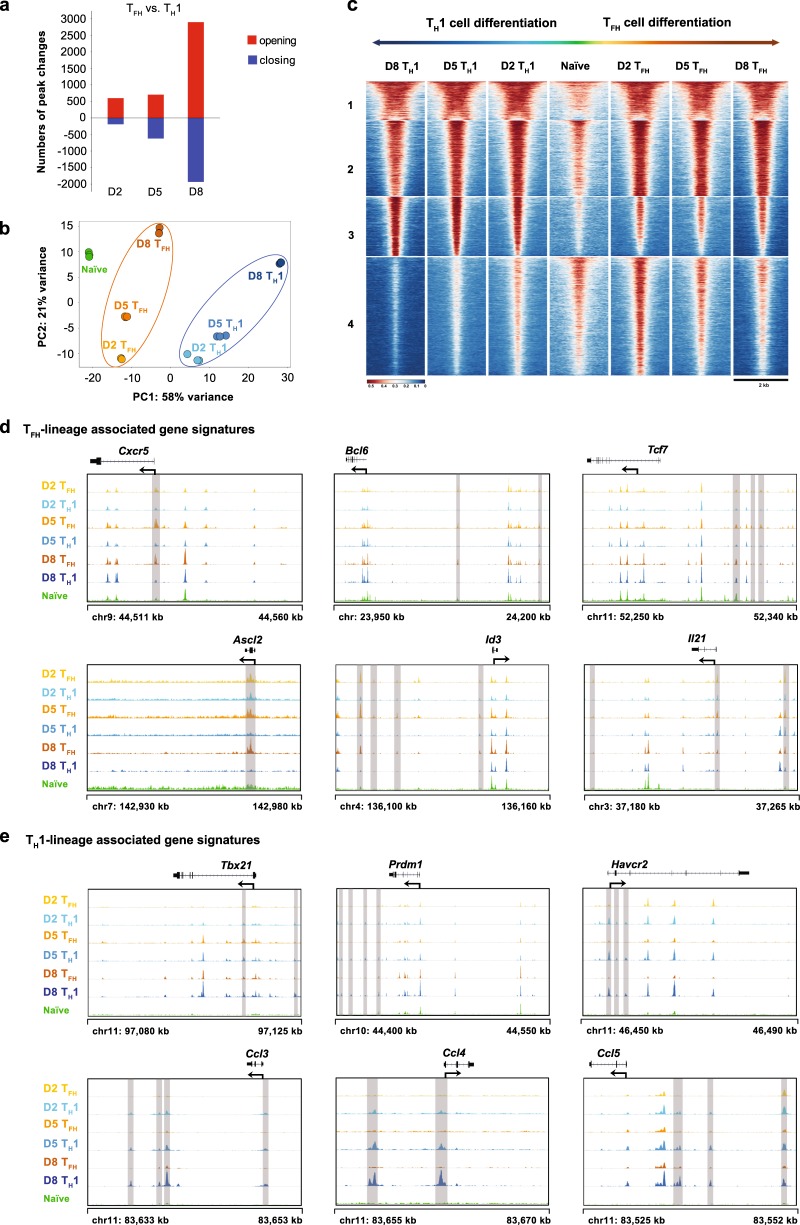
Chromatin states of the virus-specific TFH and TH1 cells in response to an acute viral infection. a Numbers of chromatin peaks with differential accessibility (FDR < 0.05; FC > 4) between SMARTA TFH cells and SMARTA TH1 cells at the indicated time points after LCMV Armstrong infection. b PCA plot of the peak accessibilities in naïve SMARTA CD4+ T cells, SMARTA TFH cells (days 2, 5 and 8 postinfection) and SMARTA TH1 cells (days 2, 5 and 8 postinfection). Each dot represents a replicate of the indicated group. c Chromatin accessibility heat map of differential peaks from a. Each row represents one of the 15,600 differential peaks that was center-aligned and extended upstream and downstream by 1 kb from the center. The peaks are K-means clustered. d ATAC-Seq signal profiles of TFH lineage-associated gene loci. e ATAC-Seq signal profiles of TH1 lineage-associated gene loci. Differential peaks are highlighted in gray (d and e). The data were obtained from one experiment with three biological replicates (pooled from at least five mice per group) (a–e)

