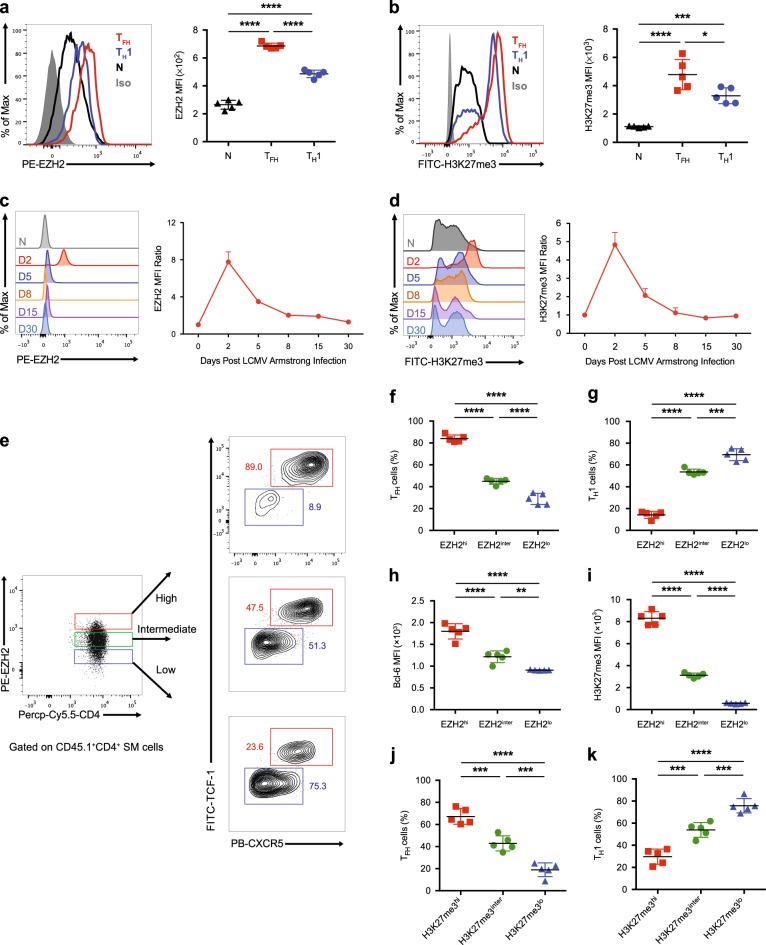
Fig. 2.
Dynamic changes in EZH2 expression and the H3K27me3 modification in virus-specific TFH cells. a, b Comparison of EZH2 (a) and H3K27me3 (b) levels between SMARTA TFH cells (CD25loCXCR5+) and SMARTA TH1 cells (CD25hiCXCR5−) from the spleens of CD45.2+ wild-type mice that underwent adoptive transfer of CD45.1+ SMARTA cells and analyzed on day 2 after LCMV Armstrong infection and in naïve (CD44loCD62Lhi) SMARTA cells (N). c, d Flow cytometry analysis of EZH2 (c) and H3K27me3 (d) levels in TFH cells derived from the mice listed in a on days 2, 5, 8, 15 and 30 after the LCMV Armstrong infection and in naïve SMARTA cells (N). The EZH2 or H3K27me3 mean fluorescence intensity (MFI) ratio at each time point was calculated as the MFI of TFH cells / MFI of CD4+CD44lo T cells in an identical mouse. e Flow cytometry analysis of the EZH2hi, EZH2inter and EZH2lo subsets of TFH cells and TH1 cells from the mice shown in a on day 2 after the LCMV Armstrong infection. The proportions of TFH cells and TH1 cells and the MFI of Bcl-6 in each population are summarized in f, g and h, respectively. i The MFI of H3K27me3 in the EZH2hi, EZH2inter and EZH2lo subsets of TFH cells described in e. The proportions of TFH cells (j) and TH1 cells (k) among the H3K27me3hi, H3K27me3inter and H3K27me3lo subsets of SMARTA cells from mice shown in a on day 2 after the LCMV Armstrong infection. *P < 0.05, ***P < 0.001 and ****P < 0.0001 (unpaired two-tailed t-test). The data are representative of two independent experiments with at least four mice per group (a–d and f–k; error bars in a–d and f–k indicate the s.d.)

