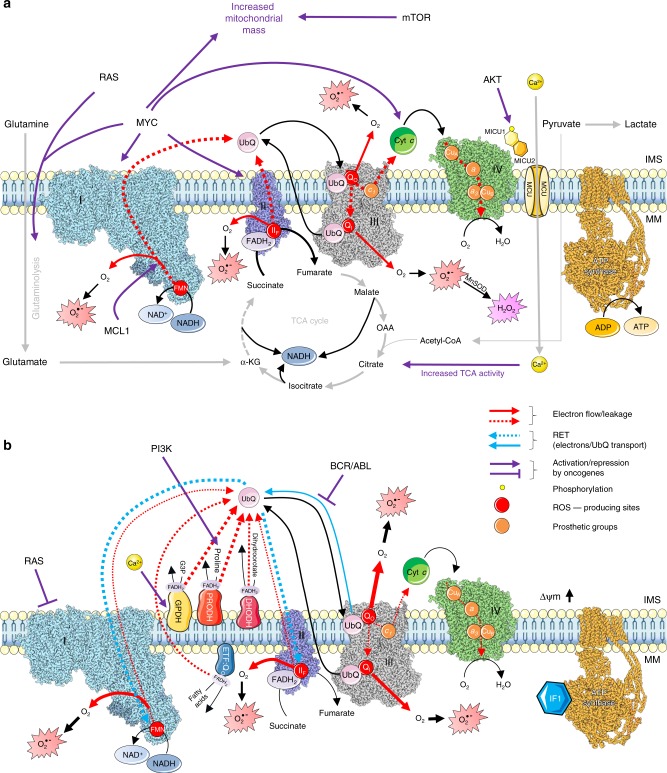
Fig. 1.
Oncogenes regulate ETC-mediated ROS production. Dashed red arrows indicate electron flow through complexes I (blue), II (purple), III (grey) and IV (green). Solid red arrows indicate electron leakage to O2 with consequent generation of O2•–, which can be converted into H2O2 by manganese superoxide dismutase (MnSOD). The arrows thickness represents the intensity of reactions/electron flux. a Enhanced electron flow through the ETC favours ROS production. RAS and MYC induce glutaminolysis, AKT phosphorylates MICU1 leading to calcium influx, and both these mechanisms promote TCA cycle activity and thus NADH production. MCL1 increases electron flow. mTOR and MYC induce mitochondrial biogenesis (purple arrows). b Destabilisation of electron flow across the ETC enhances electron leakage and ROS generation. RAS induces a decrease in complex I activity, thus disrupting the respirasome; PI3K increases proline fuelling through PRODH, bypassing complex II and destabilising electron flow; AKT-driven calcium influx promotes the activity of GPDH, thus inducing RET (light-blue arrows); BCR/ABL impairs electron transfer from complexes I and II to complex III (purple arrow and blunted arrows). IF1 blocks ATP synthase (yellow structure), leading to hyperpolarisation and inducing RET. Both the increase and destabilisation of electron flow drive ROS generation. IMS: intermembrane space. MM: mitochondrial matrix. G3P: glycerol 3-phosphate. Δψm: mitochondrial transmembrane potential. The structures of ETC complexes were obtained from RCSB Protein Data Bank: complex I (5XTD204), complex II (3AEF), complex III (5XTE204), complex IV (5Z62205) and ATP synthase (5ARA206). Structures were prepared with UCSF Chimera.207

