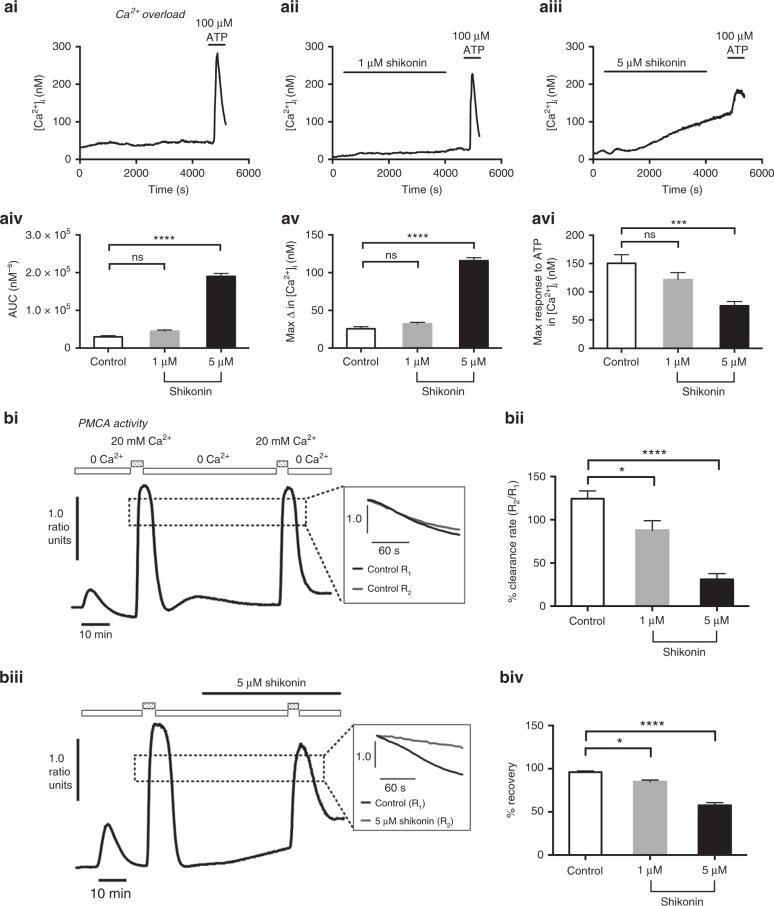
Fig. 5. PKM2 inhibitor, shikonin induces a cytotoxic [Ca2+]i overload and inhibition of the PMCA in PDAC cells.
a Cytosolic Ca2+ ([Ca2+]i) was measured in fura-2-loaded Mia PaCa-2 cells and perfused with HEPES-PSS containing shikonin for 1 h, followed by 100 μM ATP to test for cell responsiveness and thus viability. Representative traces showing changes in [Ca2+]i following treatment without (time-matched control, ai) or with 1 μM shikonin (aii) and 5 μM shikonin (aiii). Changes in [Ca2+]i were quantified and compared by calculating area under curve (AUC) during 1 h of treatment (aiv) and maximum change in [Ca2+]i before ATP treatment (av). Responses of cells to post-treatment ATP were quantified by assessing the maximum change in [Ca2+]i after ATP was applied (avi). ***p < 0.001; ****p < 0.0001 (one-way ANOVA with Dunnett’s multiple comparisons test). Data were averaged across multiple repeats (13–21 cells per experiment) for five experiments. b Effect of shikonin on PMCA activity of Mia PaCa-2 cells. Representative traces show the in situ Ca2+ clearance assay of PMCA activity for time-matched control (bi) and 5 μM shikonin (bii). Cells were treated with 30 μM CPA in zero Ca2+ containing 1 mM EGTA (white box) and 20 mM Ca2+ (dotted box) to induce Ca2+ influx. The influx-clearance phase was repeated giving a paired experimental design, and shikonin was applied during the second influx-clearance phase as shown by the black line in biii. Normalised linear clearance rate of the first (R1) and the second clearance phase (R2) over 60 s from the same starting value was compared (R2/R1 × 100%) and average data shown in bii. bi Recovery rate after the second clearance phase was compared with the baseline [Ca2+]i between the initial and the second clearance phase and quantified as % recovery (biv). Statistical significance was determined using a Kruskal–Wallis test with Tukey’s multiple comparisons, *p < 0.05.

