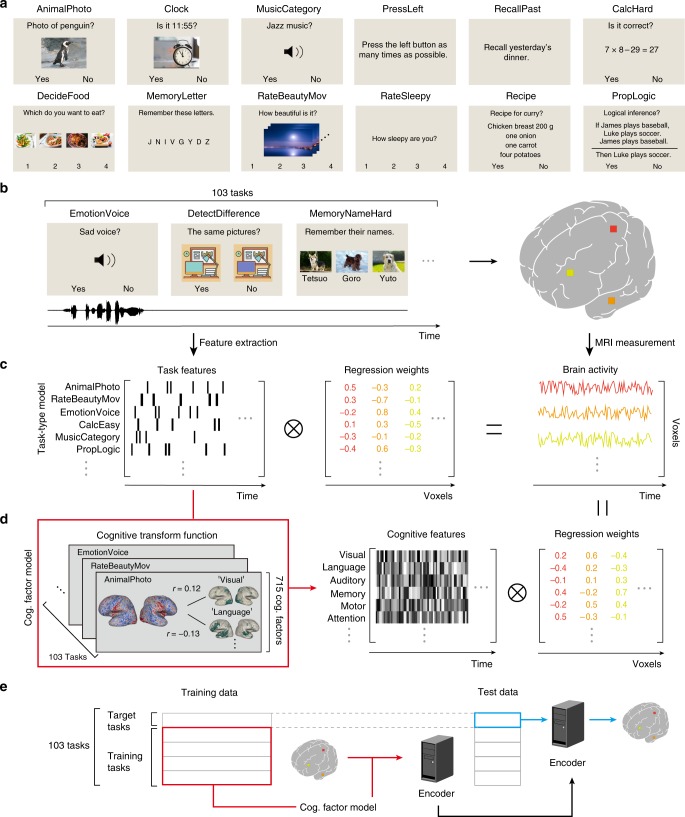
Fig. 1. Schematic diagrams of the task setting and analysis methods.
a Example image of 12 tasks, with task names described at the top. b The subjects performed 103 naturalistic tasks while the brain activity was measured using functional MRI. c Schematic of the encoding model fitting using the task-type model. d Schematic of the cognitive factor model. The cognitive transform function was calculated based on correlation coefficients between the weight maps of each task and the 715 metadata references13. Task-type features were transformed into cognitive factor features. e Schematic of the encoding model fitting using the cognitive factor model for novel tasks. Target tasks were not included in the model training datasets (in red). The trained encoder provided a prediction of brain activity (in blue). Note that some visual images used in the tasks are different from the original because of copyright protection. Penguin, clock, food, sky, desktop illustration, and dog images are provided by Storyblocks.

