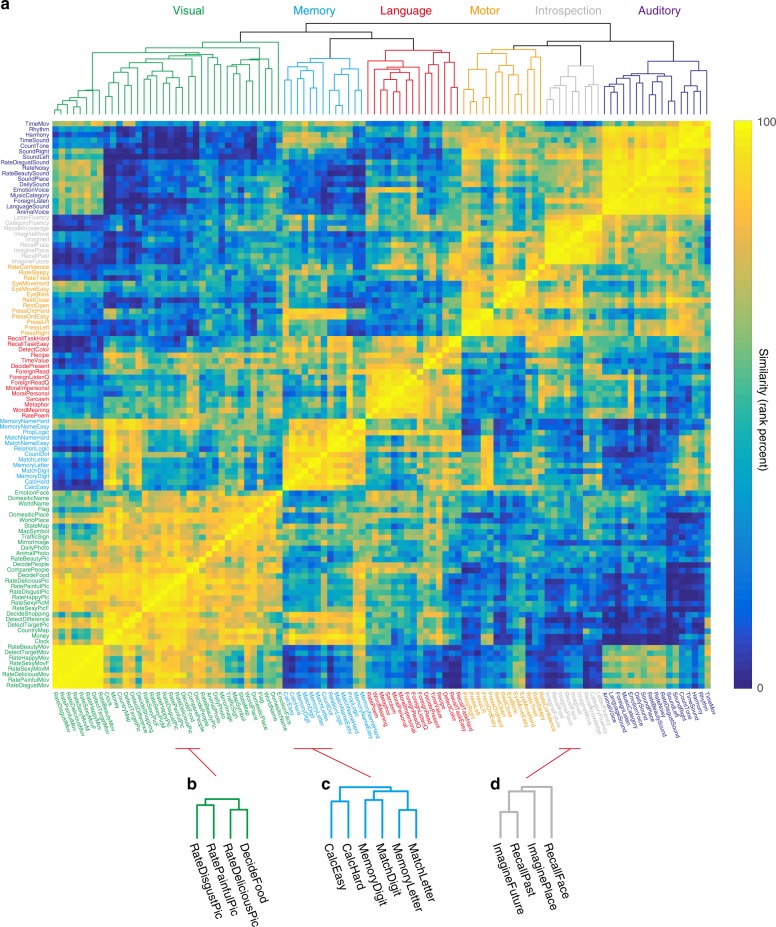
Fig. 2. Hierarchical organization of over 100 tasks.
a Representational similarity matrix of the 103 tasks (see Supplementary Methods for the descriptions of each task), reordered according to the hierarchical cluster analysis (HCA) using task-type model weights (concatenated across subjects). The dendrogram shown at the top panel represents the results of the HCA. The six largest clusters were named after the included task types. b–d Example task subclusters and their dendrograms in the visual (b), memory (c), and introspection clusters (d).

