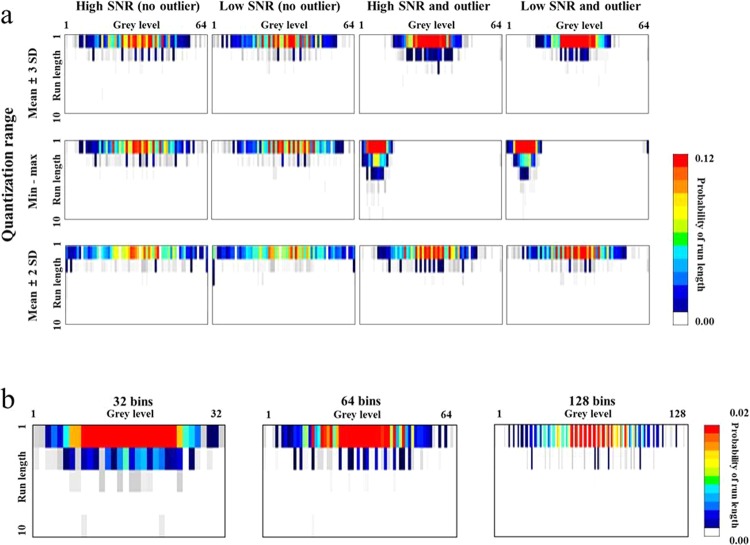
Figure 4.
Alterations in the GLRLM according to image and image processing conditions. (a) The probability in the GLRLM was distributed mostly in the upper rows as the run length of the original CT image was 3 or less. The distribution was most concentrated with mean ± 3 SD, followed by min-max, and mean ± 2 SD. Low SNR dispersed the probability distribution. The addition of outliers concentrated the distribution and shifted it to the left with the min‒max quantization range. (b) Increasing the bin number segmented the probability distribution while maintaining the overall shape.

