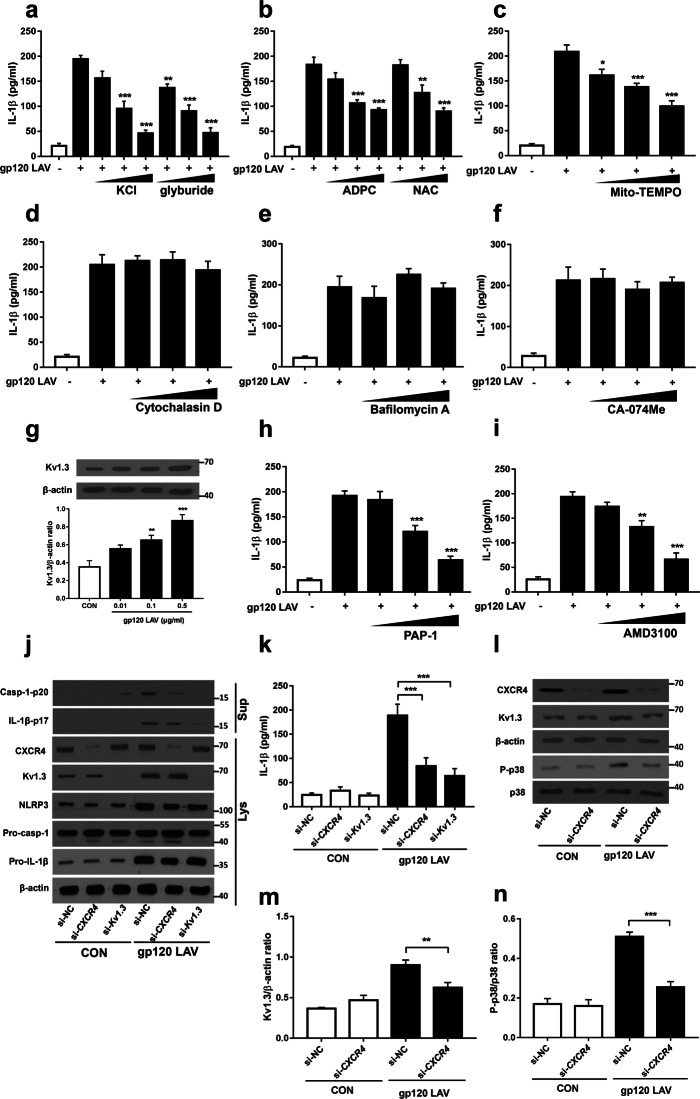
Fig. 3.
The CXCR4-Kv1.3 axis is implicated in gp120 LAV-induced NLRP3 inflammasome activation. a–f ELISA of IL-1β in supernatants of BV2 cells stimulated by gp120 LAV (0.5 μg/ml) in the presence of increasing doses of KCl (50–200 mM), the K+ efflux inhibitor glyburide (50–200 μM) (a); the ROS inhibitor ADPC (5–50 μM), NAC (5–25 μM) (b); MitoTEMPO (100–500 μM) (c); the actin polymerization inhibitor cytochalasin D (1–25 μM) (d); the lysosome inhibitor bafilomycin A (10–200 nM) (e); and the cathepsin B inhibitor CA-074Me (5–20 μM) (f). g Western blot (upper panel) and densitometric analysis (lower panel) of Kv1.3 in lysates of BV2 cells stimulated with increasing doses of gp120 LAV (0.01–0.5 μg/ml). h, i ELISA of IL-1β in supernatants of BV2 cells stimulated with gp120 LAV (0.5 μg/ml) in the presence of increasing doses of a Kv1.3-specific inhibitor (PAP-1, 0.1–2 μM) (h) or CXCR4-specific inhibitor (AMD3100, 0.1–10 μM) (i). j, k Immunoblot analysis of Casp-1-p20 and IL-1β-p17 (j) and ELISA of IL-1β (k) in supernatants (Sup) of BV2 cells transfected with control siRNA, CXCR4 or Kv1.3-specific siRNA and treated with or without gp120 LAV (0.5 μg/ml). CXCR4, Kv1.3, NLRP3, pro-casp-1, and pro-IL-1β in lysates (Lys) of these cells were also detected. l–n Western blots (l) and densitometric analysis of Kv1.3 (m) and p38-MAPK phosphorylation (P-p38, n) in lysates of BV2 cells transfected with siRNA control or CXCR4-specific siRNA and stimulated with or without gp120 LAV (0.5 μg/ml). The data are displayed as the mean ± SEM (n = 5) from three independent experiments (a–i, k, m, n). The Western blot results are representative of three (j) and five (g, l) independent experiments. *P < 0.05, **P < 0.01, ***P < 0.001

