Fig. 4.
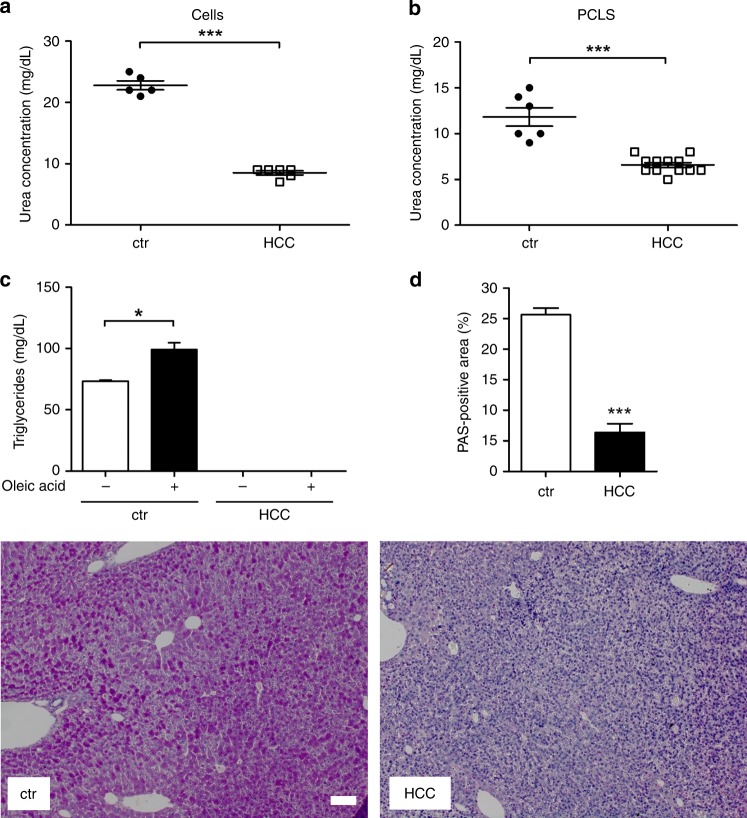
Experimental validation of urea production, intracellular triacylglyceride and glycogen storage. a Urea concentration in the supernatant of isolated hepatocytes and ASV-B cells and b PCLS. c Measurement of intracellular triacylglyceride in primary hepatocytes and isolated HCC cells without and after addition of oleic acid into the culture medium. (n = 3). d PAS staining for intracellular storage of glycogen on control and ASV-B liver sections as well as quantified PAS-positive area are depicted (ctr n = 4, HCC n = 5). Scale bar: 100 µm. *p < 0.05; ***p < 0.0001.

