Figure 1.
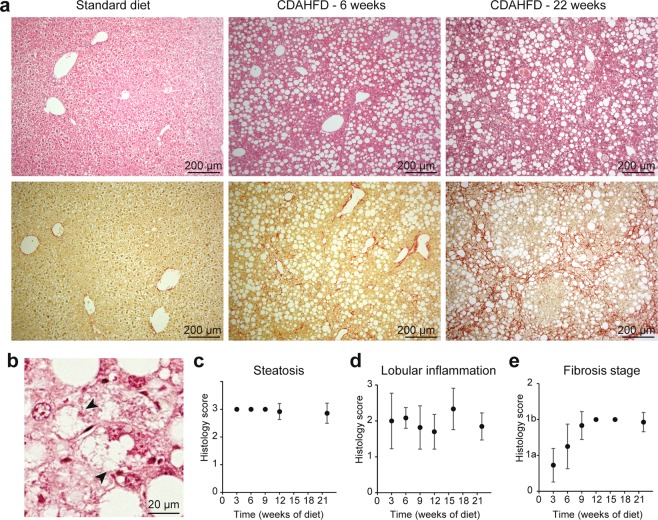
Histological characterization of CDAHFD mice model. (a) Histological colorations (top: Hematoxylin/Eosin, low: Sirius Red) of Standard Diet- or CDAHFD-fed mice for 6 or 22 weeks. (b) Example of hepatocyte ballooning in a CDAHFD-fed mice (arrowheads). (c–e) Histological scores: steatosis (c), inflammation (d) and fibrosis (e) as a function of time. The points corresponding to 3, 6 and 9 weeks in (c) and 12 and 15 weeks in (e) are not associated with an error bar because for these points, the values of the scores are identical and the standard deviation is therefore 0. (n = 10–14 for each time point, means ± standard deviation).

