Figure 2.
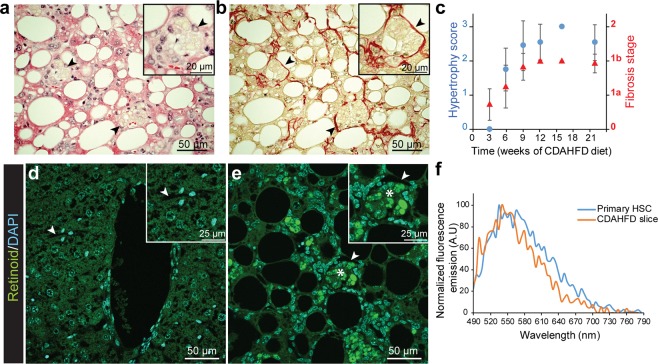
Hypertrophied cells are collocated with collagen fibers and full of fluorescent droplets. (a,b) Collocation (arrowheads) of hypertrophied cells (a, HE staining) and collagen fibers (b, Sirius Red staining) at 9 weeks of CDAHFD. (c) Cell hypertrophy (blue dots) and fibrosis (red triangles) scores as a function of CDAHFD time. (n = 10–14 for each time point, means ± standard deviation). (d,e) Combined images of DAPI (cyan, λexc = 405 nm) and retinoid (green, λexc = 488 nm) fluorescent signals on 9 weeks SD- (d) and CDAHFD-fed mice (e) liver slices. (Arrowheads: sinusoidal space, stars: retinoid fluorescent droplets). (f) Normalized fluorescence emission spectra of retinoid droplets in primary murine HSCs (blue) and 12 weeks CDAHFD-fed mouse liver slice (orange), measured by confocal microscopy (λexc = 480 nm, λem = 490–790 nm).

