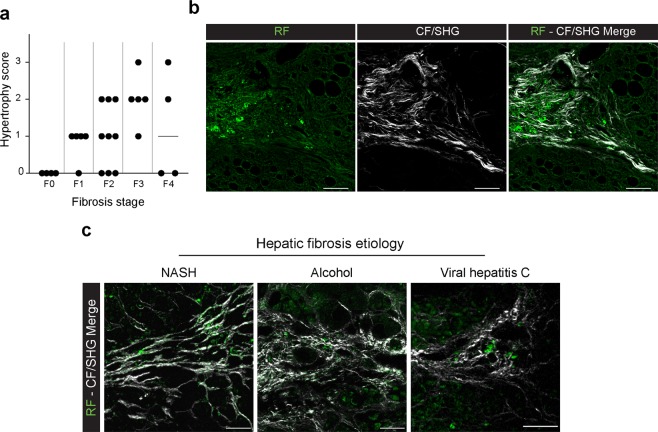
Figure 7.
Hypertrophy of HSC is observed in human hepatic fibrosis. (a) Liver fibrosis and HSC hypertrophy scores on 27 human liver biopsies from FIBROTA cohort. (b) Representative images of collocation of retinoid droplets imaged by fluorescence (RF) and collagen by second harmonic generation (CF/SHG) signal on human liver biopsy from FIBROTA cohort exhibiting F3 liver fibrosis. (c) Merge of retinoid fluorescence (RF) and collagen fibers (CF/SHG) imaged by fluorescence and second harmonic generation microscopy on human liver biopsy with fibrosis due to different etiologies: NASH (F2), Viral Hepatitis C (F2) and alcoholism (F4). Scale bar: 50 µm.

