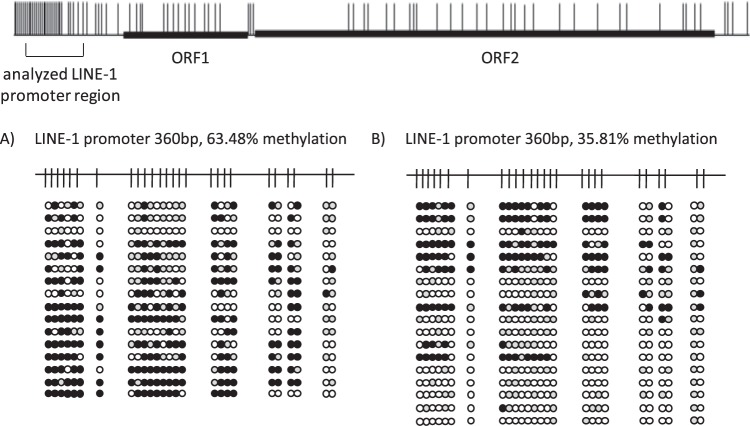
Figure 3.
Bisulfite genomic sequencing of the LINE-1 promoter region in primary uroepithelial cells before and after ODC1 RNA interference. Detailed analyses of LINE-1 promoter CpG methylation status of primary uroepithelial cells (A) and of the same uroepithelial cells after 72 h of treatment with ODC1 RNAi (B). Black, white and grey circles stand for methylated, unmethylated and undefined CpG dinucleotides, respectiely. The graph at the top of the figure depicts a schematic representation of a full-length LINE-1 retroelement with the proportional distribution of all CpG dinucleotides (short ertical strokes) and the open reading frames 1 and 2 (ORF1/2). The CpG rich region analyzed by bisulfite genomic sequencing is highlighted by a square bracket.

