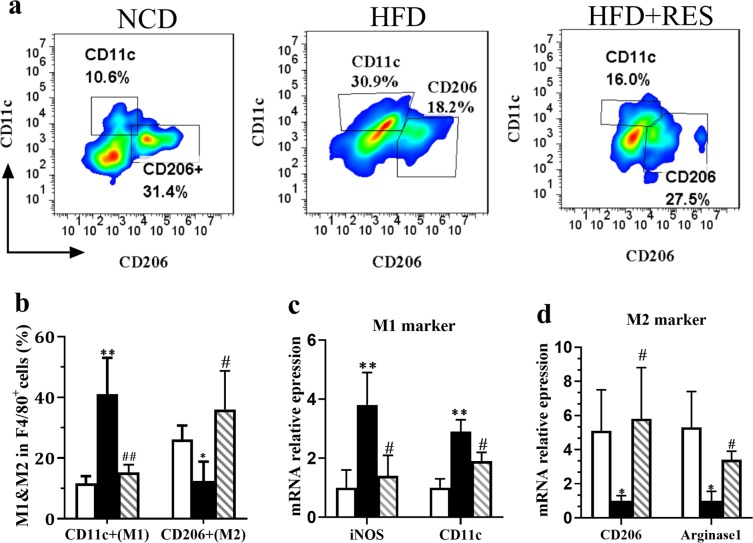
Figure 3.
Resveratrol switched M1 to M2 macrophages. (a) Representative flow cytometry plots and the sequential gating strategy for CD11c and CD206 markers in CD11b and F4/80 dual positive cells for analysis of macrophages polarization in skeletal muscle tissue of NCD, HFD and HFD + RES groups. (b) Percentage of CD11c+ cells and CD206+ cells in total macrophages. (c) iNOS and CD11c (M1 markers) mRNA expression in skeletal muscle tissue. (d) CD206 and arginase1 (M2 markers) mRNA expression in skeletal muscle tissue. All data were analyzed by one-way ANOVA, Tukey post-test Values are expressed as means ± SD *p < 0.05, **p < 0.01, ***p < 0.001 vs. the control group. #p < 0.05, ##p < 0.01, ###p < 0.001 vs. the HFD group.

