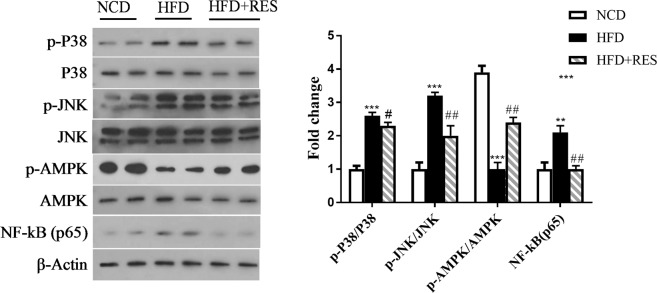
Figure 7.
Representative western blot is shown. Phosphorylated p38, total p38, phosphorylated JNK, total JNK, phosphorylated AMPK, total AMPK and NF-κB (p65), and control β-Actin levels were evaluated by immunoblot analysis. Protein bands were quantified by densitometry and normalized to β-Actin levels. Full-length blots are presented in Supplementary Fig. 3. All data were analyzed by one-way ANOVA, Tukey post-test. Data are presented as means ± SD *p < 0.05, **p < 0.01, ***p < 0.001 vs. the control group. #p < 0.05, ##p < 0.01, ###p < 0.001 vs. the HFD group.

