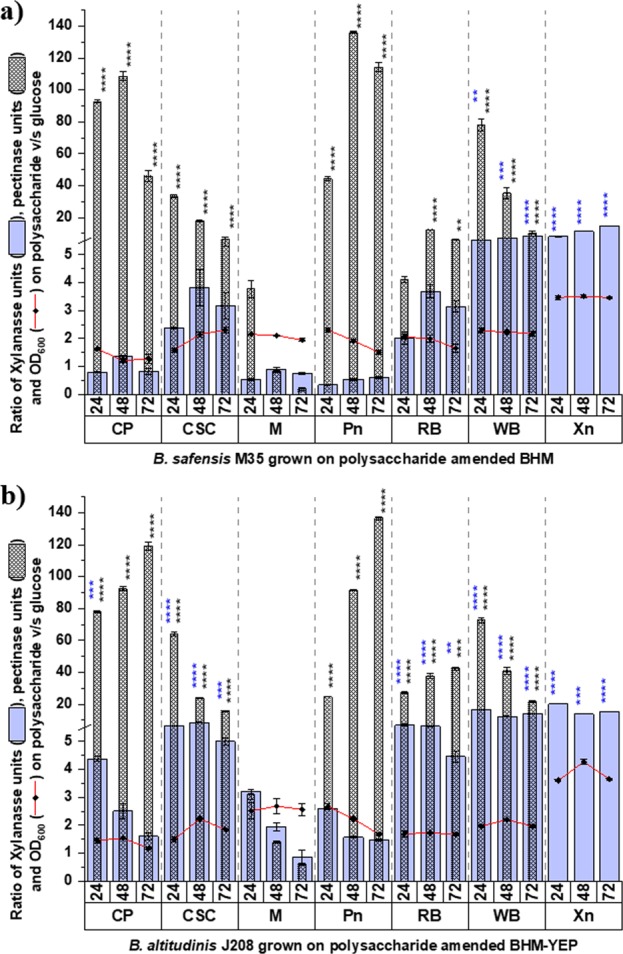
Figure 2.

Screening of substrates for induction of xylanases and pectinases individually. Comparison of normalized growth ratio with normalized activity ratio of xylanase (blue column) as well as pectinase (dotted column) for (a) B. safensis M35 and (b) B. altitudinis J208; Values plotted are Mean ± Standard Error of Mean (SEM) for n = 3; Asterisk marks depicts significant difference between xylanase (blue coloured *) as well as pectinase (black coloured *) activity ratio from growth ratio (* = p < 0.05, ** = p < 0.01, *** = p < 0.001 and **** = p < 0.0001).
