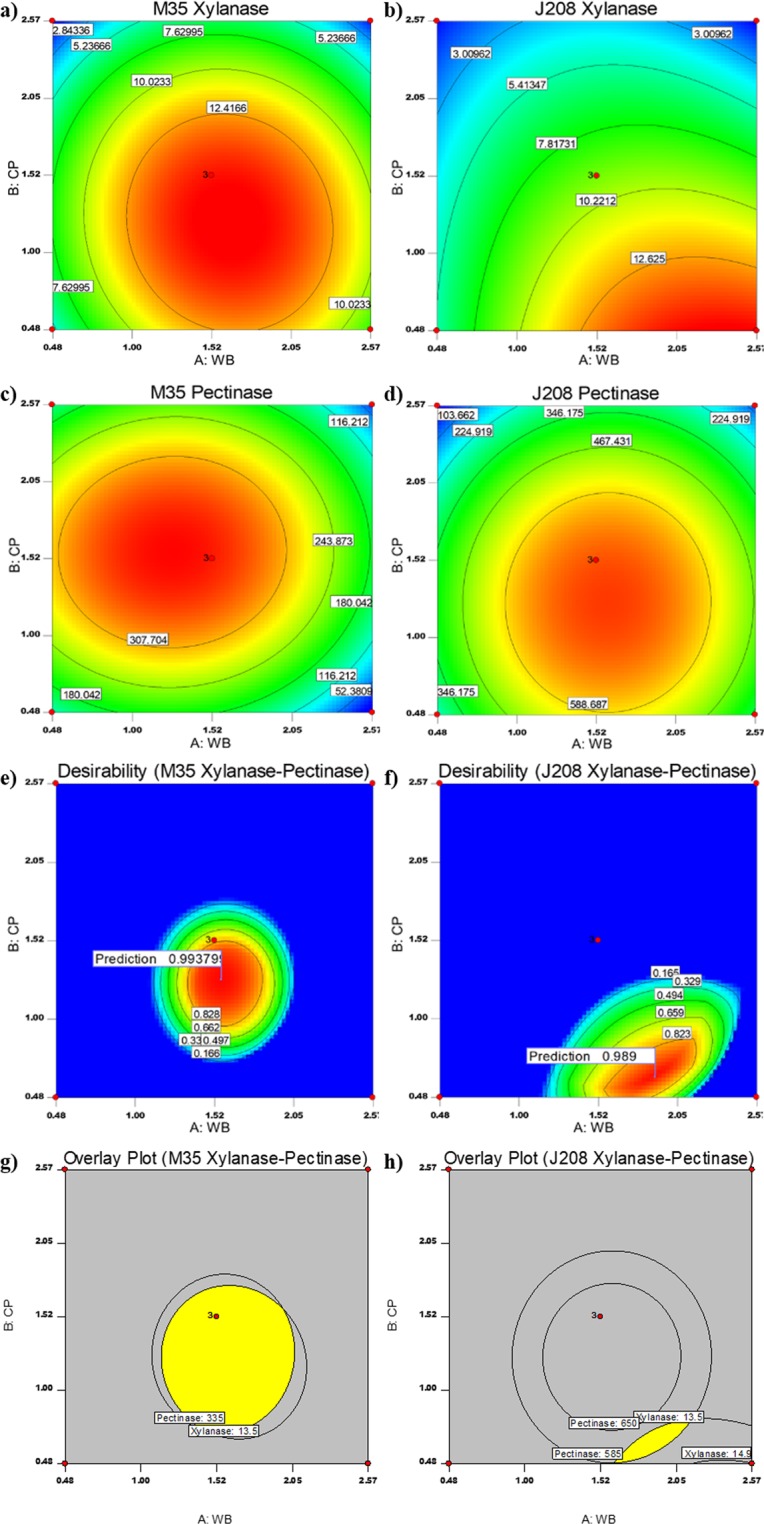
Figure 3.

Contour plots, Desirability plots and Overlay pots for response surface prediction. (a–d) Contour plots exhibiting effects of WB and CP on xylanase production responses from (a) B. safensis M35 and (b) B. altitudinis J208; pectinase production responses from (c) B. safensis M35 and (d) B. altitudinis J208. The values represented in each box beside the contour line represent the respective enzyme activity units and are Mean for n = 3; (e–h) Desirability and Overlay plots for optimized responses of xylanase and pectinase production. X and Y-axis represents concentration (in % w/v) of WB and CP respectively; For desirability plots of (e) B. safensis M35 and (f) B. altitudinis J208, value in each box beside contour line represents the desirability value obtained through numerical optimization; For overlay plots of (g) B. safensis M35 and (h) B. altitudinis J208, value in large box represents the predicted maximum responses at mentioned variable concentrations obtained through graphical method; Yellow-coloured region in overlay plots (g,h) indicates the range of predicted highest response.
