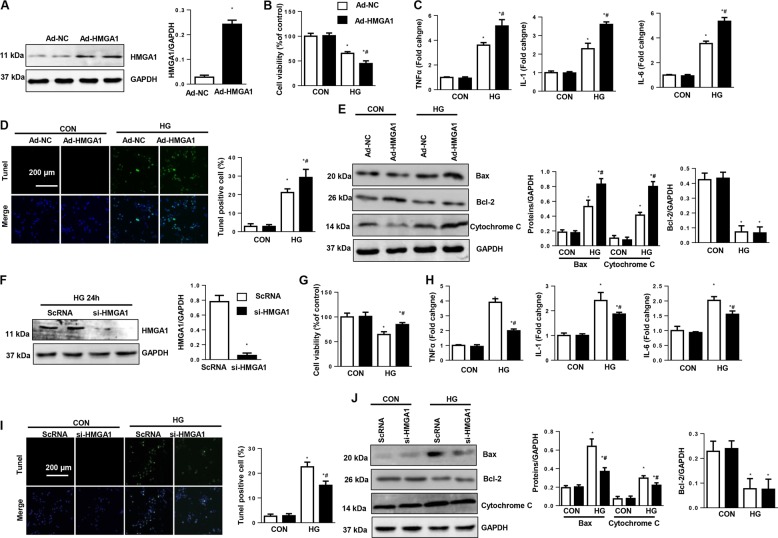
Fig. 2. HMGA1 promotes high-glucose-induced inflammation and apoptosis in vitro.
a Western blot image and quantification of HMGA1 in NRCMs transfected with Ad-HMGA1 (n = 6, *P < 0.05 vs. the Ad-NC group). b–e NRCMs were transfected with Ad-HMGA1 and then stimulated with HG for 48 h. b Cell viability detected by MTT assay in NRCMs in the indicated group (n = 6). c mRNA expression of proinflammatory markers in NRCMs (n = 6). d TUNEL staining and quantification results in NRCMs (n = 5). e Western blot image and quantification of Bax, Bcl-2, and cytochrome C (n = 6). *P < 0.05 vs. the Ad-NC-CON group; #P < 0.05 vs. the Ad-NC-HG group. f Western blot image and quantification of HMGA1 in NRCMs transfected with HMGA1 siRNA (n = 6, *P < 0.05 vs. the ScRNA group). g–j NRCMs were transfected with HMGA1 siRNA and then stimulated with HG for 48 h. g Cell viability detected by MTT assay in NRCMs (n = 6). h mRNA levels of proinflammatory markers in NRCMs (n = 6). i TUNEL staining and quantification results in NRCMs (n = 5). j Protein expression of Bax, Bcl-2, and cytochrome C (n = 6). *P < 0.05 vs. the ScRNA-CON group; #P < 0.05 vs. the ScRNA-HG group. All the in vitro experiments were performed independently for three times.

