
Figure 8.
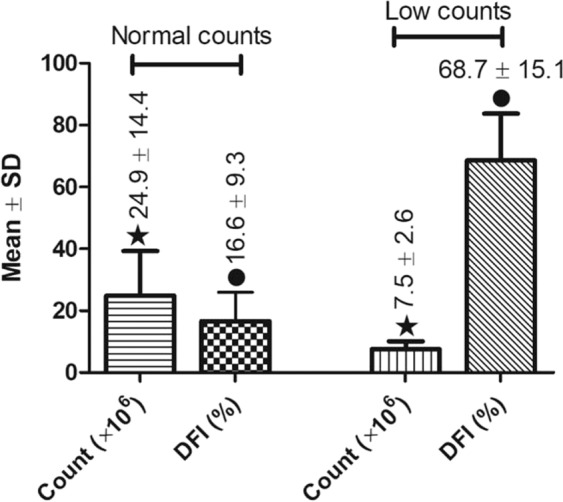
Comparisons of sperm counts and DFI between a group of males with abnormally low sperm counts (n = 10) and a group of males with normal sperm counts (n = 24). P < 0.0001 between two bars with the same symbol.
Official websites use .gov
A
.gov website belongs to an official
government organization in the United States.
Secure .gov websites use HTTPS
A lock (
) or https:// means you've safely
connected to the .gov website. Share sensitive
information only on official, secure websites.
Comparisons of sperm counts and DFI between a group of males with abnormally low sperm counts (n = 10) and a group of males with normal sperm counts (n = 24). P < 0.0001 between two bars with the same symbol.