Fig. 4.
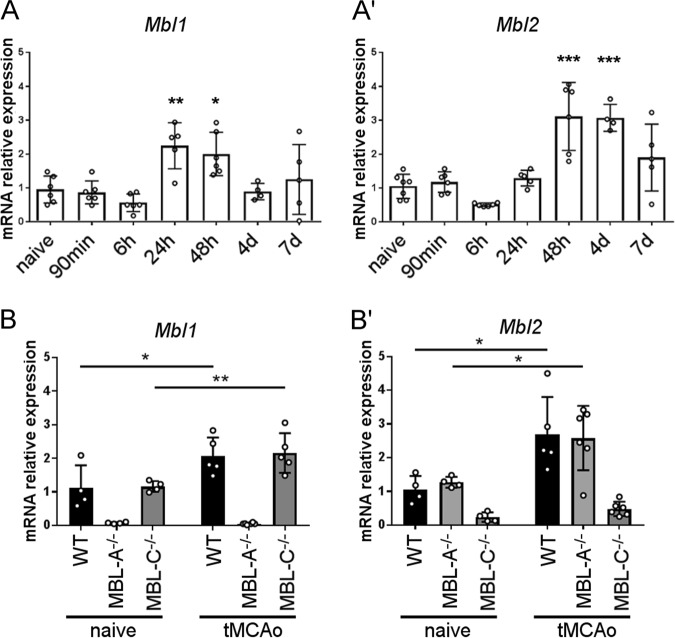
Hepatic gene expression of Mbl1 and Mbl2 after 48 h of reperfusion in MBL−/−, MBL-A−/−, and MBL-C−/− mice. a, The time course of Mbl1 (a) and Mbl2 (a’) hepatic expression in WT mice showed overexpression of Mbl1 at 24 h and 48 h and overexpression of Mbl2 at 48 h and 4 d after tMCAo. The data are shown as bars with individual values ± SDs (n = 5–6); one-way ANOVA followed by Dunnett’s post hoc test, *p < 0.05, **p < 0.01, ***p < 0.001 vs. naive. b At 48 h after tMCAo, Mbl1 hepatic expression in MBL-C−/− mice was induced to the same extent as that in WT mice (b). The data are shown as bars with individual values ± SDs (n = 4–6); two-way ANOVA followed by Sidak’s post hoc test, *p < 0.05, **p < 0.01. At 48 h after tMCAo, Mbl2 hepatic expression in MBL-A−/− mice was induced to the same extent as that in WT mice (b'). The data are shown as bars with individual values ± SDs (n = 4–6), Welch-corrected ANOVA for unequal variances, *p < 0.05

