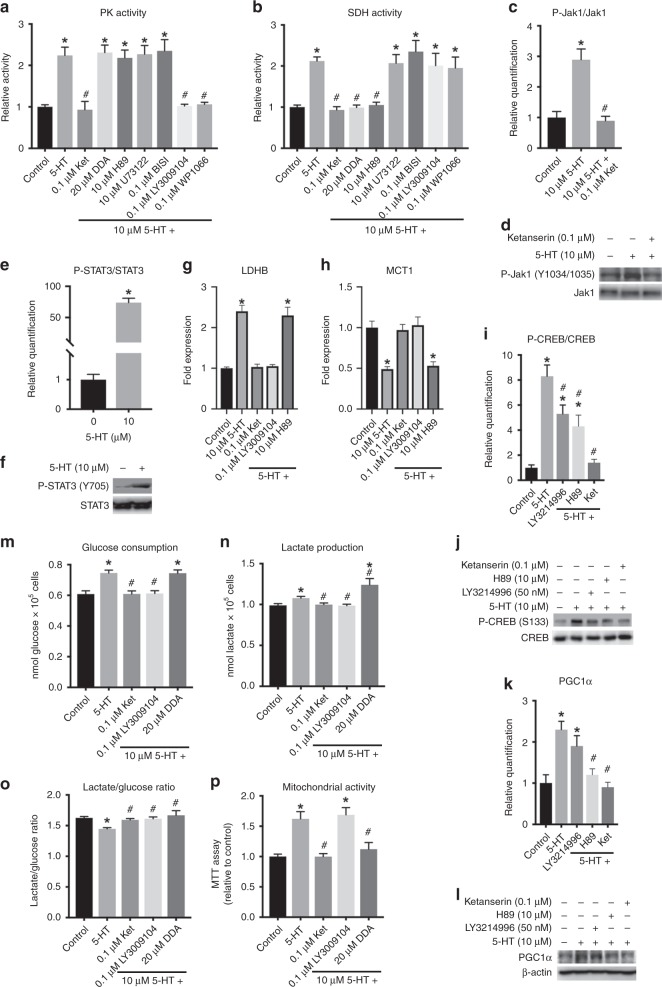
Fig. 3.
Intracellular molecular mechanisms for the serotonin actions on metabolism of MCF-7 cells. a Pyruvate kinase and b succinate dehydrogenase activities in the presence of 5-HT and several inhibitors and antagonists. Plotted values represent the means ± S.E.M. of six independent experiments (n = 6). *P < 0.05 as compared with control. #P < 0.05 as compared with 5-HT. One-way ANOVA followed by Tukey’s post test. Quantification (c) and representative western blot (d) of Jak1 phosphorylation. Quantification (e) and representative western blot (f) of STAT3 phosphorylation. g LDHB mRNA expression. h MCT1 mRNA expression. i Quantification of CREB phosphorylation. j Representative western blot for CREB phosphorylation. k Quantification of PGC1α expression. l Representative western blot for PGC1α expression. For c–l, plotted values represent means ± S.E.M. of seven independent experiments (n = 7). * and #P < 0.05 as compared with control or to 10 µM 5-HT, respectively (Student’s t test for panel E and one-way ANOVA followed by Tukey’s post test for panels c, g, h, i, k). m Glucose consumption. n Lactate production. o Lactate production/glucose consumption ratio. p Mitochondrial activity. For m–p, plotted values represent means ± S.E.M. of five independent experiments (n = 5; * P < 0.05 as compared with control; #P < 0.05 as compared with 5-HT; one-way ANOVA followed by Tukey’s post test)

