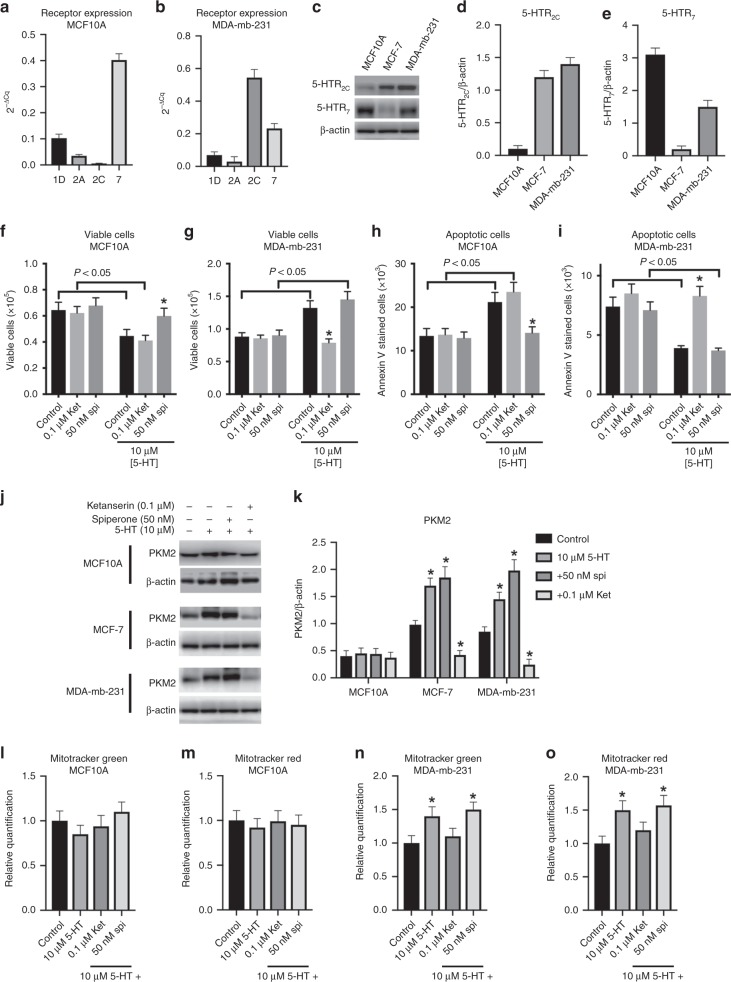
Fig. 4.
Effects of 5-HT on MCF10A and MDA-mb-231 cells biology. Expression pattern of 5-HT receptors was evaluated by qPCR in MCF10A (a) and MDA-mb-231 (b) cells. Representative western blots for 5-HTR2C and 5-HTR7 on MCF10A. MCF-7 and MDA-mb-231 cells (c). Relative quantification of western blots for 5-HTR2C (d) and 5-HTR7 (e) in comparison with the loading control β-actin (n = 3). Cell viability analysis of MCF10A (f) and MDA-mb-231 (g) cells (n = 3; * means P < 0.05 as compared with control in the presence of 5-HT or the absence of ketanserin or spiperone, and the bracket indicates P < 0.05 as compared with the absence of 5-HT; two-way ANOVA, followed by Sidak’s post test). Apoptosis analysis of MCF10A (h) and MDA-mb-231 (i) cells (n = 3; * means P < 0.05 as compared with control in the presence of 5-HT or the absence of ketanserin or spiperone, and the bracket indicates P < 0.05 as compared with the absence of 5-HT; two-way ANOVA, followed by Sidak’s post test). Representative western blots (j) and quantification (k) of PKM2 expression in the MCF10A, MCF-7 and MDA-mb-231 cell lines (n = 3. * means P < 0.05 as compared with control for each cell line; one-way ANOVA, followed by Tukey’s post test). MitoTracker Green (l) and MitoTracker Red (m) labelling of MCF10A cells (n = 3; one-way ANOVA, followed by Tukey’s post test). MitoTracker Green (n) and MitoTracker Red (o) labelling of MDA-mb-231 cells (n = 3. * means P < 0.05 as compared with control for each cell line; one-way ANOVA, followed by Tukey’s post test)

