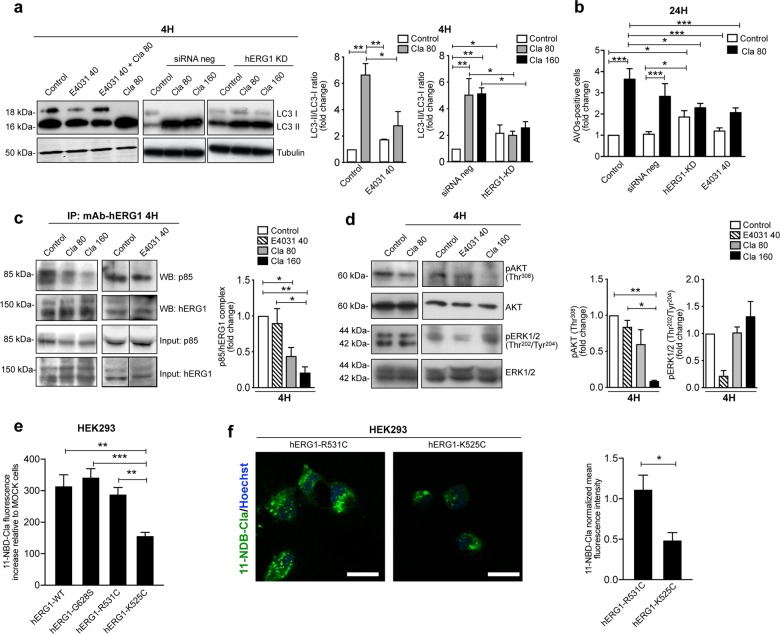
Fig. 3. Clarithromycin modulates autophagy by targeting hERG1.
a LC3 protein levels assessed by WB in HCT116 cells transfected for 24 h with specific α-hERG1 siRNAs (hERG1-KD) or with siRNA negative control (siRNA neg), or of HCT116 wild type cells treated with E4031 (40 µM59), after 4 h Cla treatment (80 and 160 µM). The corresponding densitometric results are given in the bar graph (n = 3). b Accumulation of acidic vesicular organelles (AVOs) in the same cells as in (a), after 24 h of treatment with 80 μM Cla. Data are expressed as fold increase of AVOs-positive cells compared to HCT116 WT control-treated cells (n = 3). c Co-immunoprecipitation of hERG1 and the p85 subunit of PI3K from HCT116 cells treated with Cla (80 and 160 µM) or E4031 (40 µM) for 4 h. The corresponding densitometric results are given in the bar graph (n = 3). d Expression of phospho-ERK1/2Thr202/Tyr204 and phospho-AktThr308 in HCT116 cells treated as in (c) for 4 h. The membranes were re-probed with anti-ERK1/2 or anti-Akt antibodies, to normalize the amounts of phosphorylated corresponding proteins. The densitometric results are given in the bar graphs (n = 3). e Cla binding assay in HEK293 cells expressing hERG1 (hERG1-WT) and hERG1 mutants with different conformational state. The biding of fluorescently labeled 11-O-{3-[(7-nitro-2,1,3-benzoxadiazol-4-yl)amino]propyl}-6-O-methyl-erythromycin A (11-NBD-Cla) was determined, as detailed in Materials and Methods. The following hERG1 mutants were used: hERG-G628S, hERG1-R531C, and hERG1-K525C. Fluorescence intensities were normalized on total protein content, the intensity obtained in HEK293 MOCK-transfected cells was subtracted, and the obtained fluorescence intensity values were then normalized on the relative hERG1 expression in the different HEK293 transfected cells mutants according to data shown in ref. 48 (n = 3). f Confocal microscopy images obtained in the same cells and experimental conditions as in (e). Top focal plane of the z-stack images for HEK293 cells transfected with the hERG1-R531C and the hERG1-K525C mutants. Mean cell fluorescence measured at top section z-stack and normalized on the selected cell area are shown in the bar graph. The results are representative of three independent experiments (total number of cells analyzed for each group = 21) (scale bar, 20 µm). Statistical significance for the indicated comparisons was assessed with one-way ANOVA for (a–e), and with Student’s t test for (f); *P < 0.05, **P < 0.01, and ***P < 0.001.

