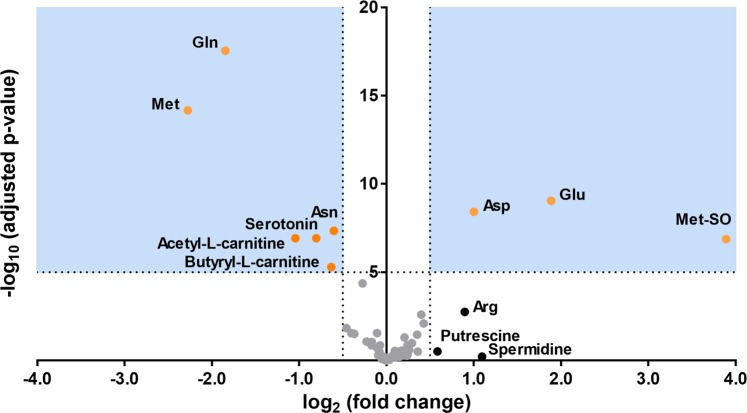
Figure 2.
Volcano plot of the 76 non-lipid metabolites (amino acids, biogenic amines, acyl-carnitines, and hexose) derived from the comparison between patients with active tuberculosis and those in the other groups (i.e., patients with latent tuberculosis and healthy controls). The p-values are adjusted for the false discovery rate against the log2 fold changes. For each metabolite, the log2 fold change is displayed on the x-axis and the -log10 (p-value adjusted for false discovery rate) is displayed on the y-axis. Cutoff points for the p-value (<0.00001; −log10 (0.00001) = 5) or fold change (> 1.414; log2 (1.414) = 0.5 or <0.707; log2 (0.707) = −0.5) are indicated with dotted lines. The areas fulfilling both criteria are colored in blue, and the metabolites belonging to the area are shown as orange dots. Metabolites fulfilling only one criterion are shown as black dots; the others are colored in grey. Abbreviations: Glu, glutamate; Gln, glutamine; Met, methionine; MetSO, sulfoxy methionine; Asp, aspartate; Asn, asparagine; Arg, arginine.

