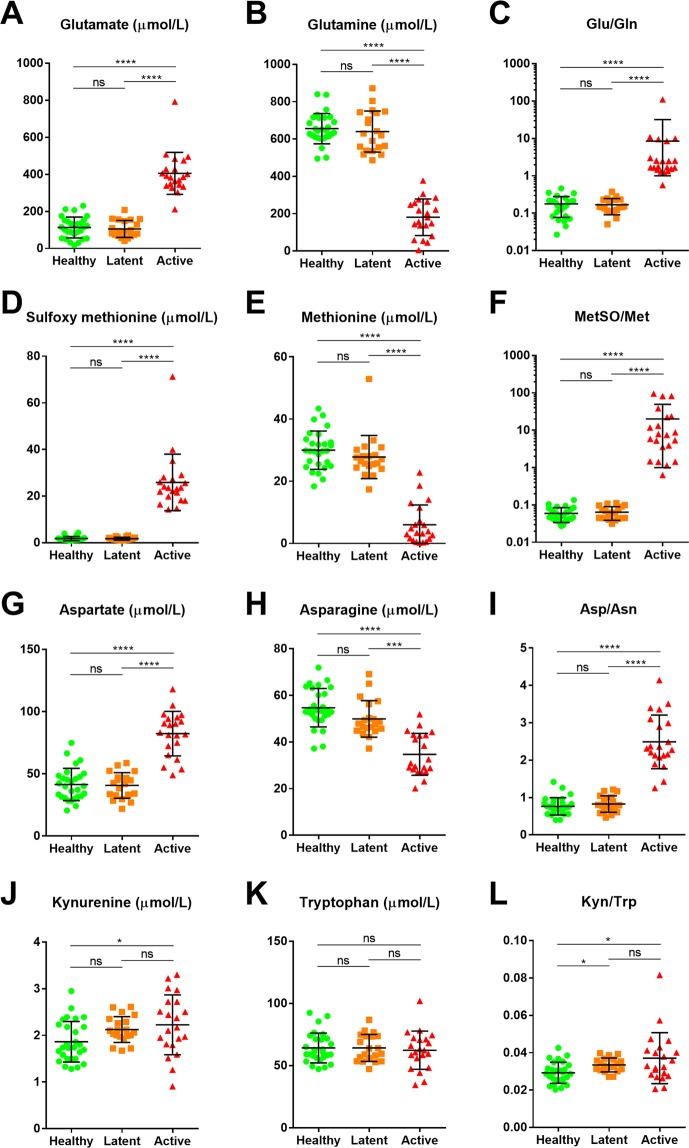
Figure 3.
The levels or ratios of selected metabolites among study populations. The median values of selected metabolites and their ratios were compared among the healthy population, patients with latent tuberculosis, and patients with active tuberculosis using Kruskal-Wallis tests. Note that the figures representing Glu/Gln and MetSO/Met ratio are in a logarithmic scale (C and F), while the others are on a linear scale. Abbreviations: Glu, glutamate; Gln, glutamine; Met, methionine; MetSO, sulfoxy methionine; Asp, aspartate; Asn, asparagine; Kyn, kynurenine; Trp, tryptophan.

