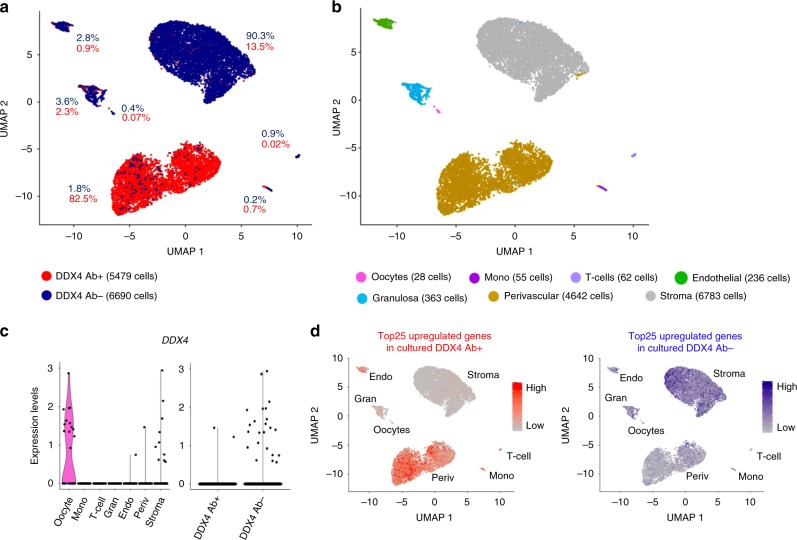
Fig. 4. Transcriptome analysis of sorted DDX4 Ab+ and Ab− ovarian cortex cells.
Ovarian cortex cells were sorted into DDX4 Ab+ or Ab− populations and sequenced on a single-cell level. a After quality control and filtration, 5479 of Ab+ and 6690 of Ab− cells were available for downstream analysis. Non-hierarchical cluster analysis revealed that 82.5% of the DDX4 Ab+ cells form a distinct cluster while all other clusters mainly consisted of DDX4 Ab− cells. b Differential gene expression analysis revealed seven main cell types. DDX4 Ab− cells mainly contributed to stroma, endothelial cells, granulosa cells, T-cells, monocytes, and oocytes. DDX4 Ab+ cells made up the cluster identified as perivascular cells. c Violin plot showing the expression of DDX4 among the different clusters (left) as well as among the sorted Ab+ and Ab− populations (right). d Comparison of sorted scRNA-seq data to single-cell transcriptome analysis of cultured DDX4 Ab+ and Ab− ovarian cells. Top 25 upregulated genes of cultured DDX4 Ab+ and Ab− cells were superimposed as expression score on to our uncultured sequenced DDX4 Ab+ and Ab− cells. The upregulated genes from cultured DDX4 Ab+ cells (scale bar depicting low expression in grey and high expression in red) are highly expressed in the perivascular and endothelial clusters, whereas the upregulated genes in cultured DDX4 Ab− cells (scale bar depicting low expression in grey and high expression in blue) are not found in these clusters. UMAP uniform manifold approximation and projection.

