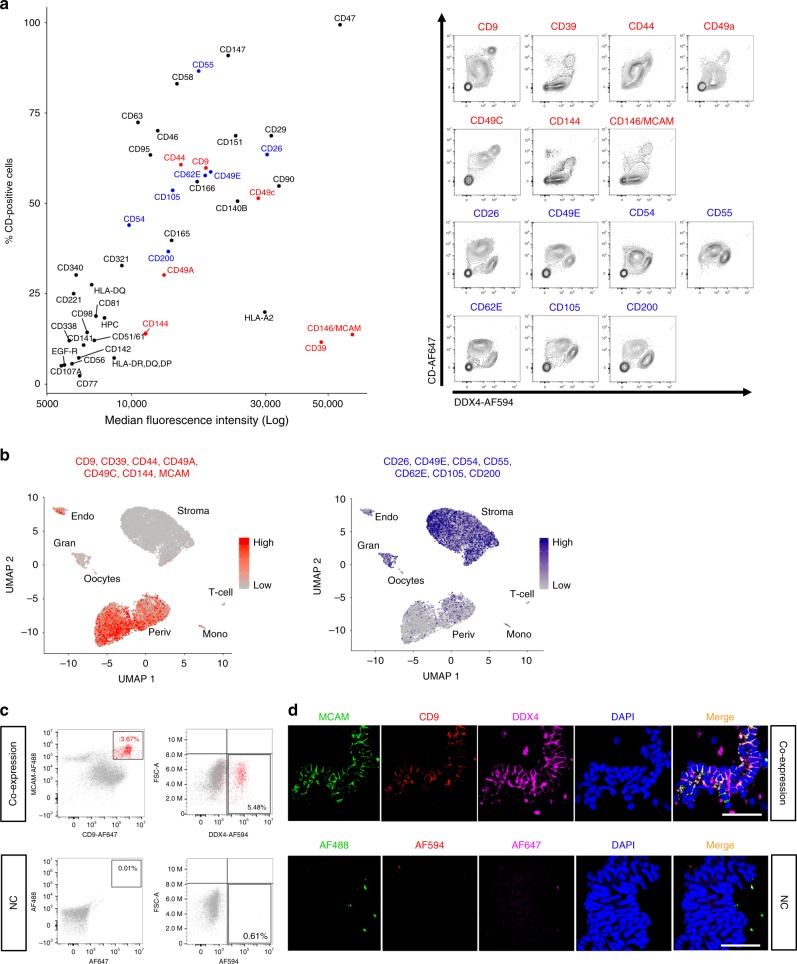
Fig. 6. Screening of ovarian cortex cells for surface proteins.
The surface of ovarian tissue cells was screened for the expression of 242 CD markers by flow cytometry. a Dot plot showing the log median fluorescence intensity (MFI, x axis) and the percentage of CD-positive cells (y axis) for those 43 CD markers that were repeatedly found to be present on ovarian tissue cells (left, CD marker expression values of repeat number three are shown as representatives). When co-stained with DDX4 Ab, seven of the markers were highly expressed (red) and seven were absent or lowly expressed (blue) on DDX4 Ab+ cells when compared with the DDX4 Ab− cell population. Co-expression of DDX4 and the 14 markers identified as high or low in DDX4 Ab+ cells is shown in representative contour plots (right). X axes display intensity of DDX4 Ab signal, y axes display intensity of CD marker signal. b Feature plots showing expression scores of the seven cell surface markers highly expressed in DDX4 Ab+ cells (scale bar depicting low expression in grey and high expression in red) and the seven markers lowly expressed in DDX4 Ab+ cells (scale bar depicting low expression in grey and high expression in blue) overlaid with our sorted scRNA-seq data. While markers that were found to be highly expressed in DDX4 Ab+ cells on a protein level are mainly expressed in perivascular cluster, CD markers lowly expressed in DDX4 Ab+ cells show a more disperse expression pattern. c FACS dot plots showing the co-expression of MCAM and CD9, two markers brightly expressed on DDX4 Ab+ cells, in regard to DDX4 Ab+ and Ab− cell populations. Around 3.67% of ovarian cortex cells were double positive for MCAM and CD9 (in red) and 5.48% are DDX4 Ab+. Around 80% of MCAM/CD9 double positive cells co-stained with DDX4 Ab (2.94% of MCAM+/CD9+/DDX4+ cells in total). Flow analysis was repeated in two independent experiments. d Unfiltered lysate of ovarian cortex cells cytospinned and stained for MCAM (green), CD9 (red), and DDX4 (magenta) showing co-expression of all three markers on blood vessels. As negative control, primary antibodies were omitted. DAPI (blue) was used as nuclear counterstain. Scale bars: 50 µm. Immunostaining was performed in duplicates in two independent experiments and a representative image is shown. All visible vessels stained positive for MCAM/CD9/DDX4. FACS fluorescence-activated cell sorting, MFI median fluorescence intensity, NC negative control, UMAP uniform manifold approximation and projection.

